
Dashboards allow you to quickly view the information that you want to see the most.
Creating a New Dashboard
-
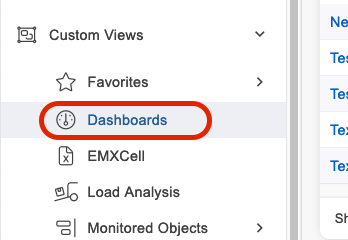
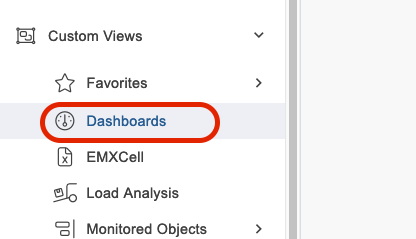
Choose Custom Views > Dashboards from the left navigation bar.
-
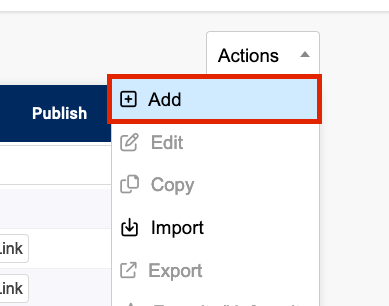
Click the + add option under the actions button.
-
Create a dashboard name.
-
You can now add gauges to your new dashboard.
Adding a Gauge
-
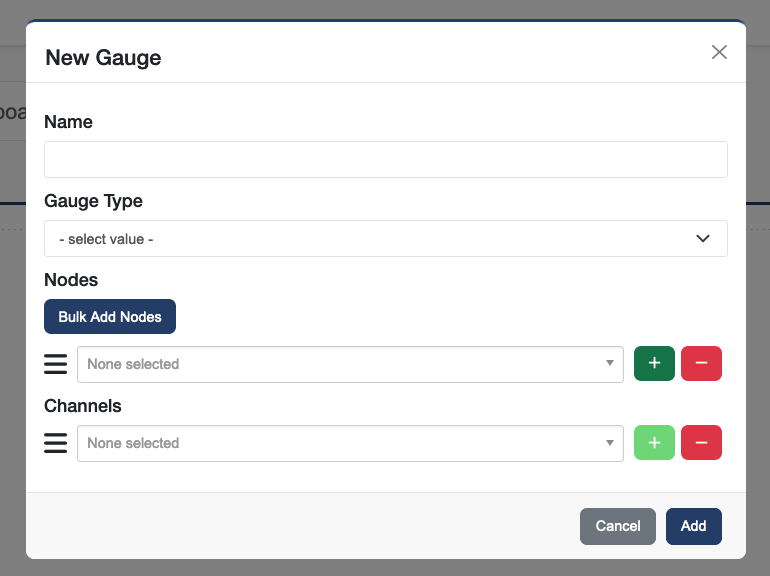
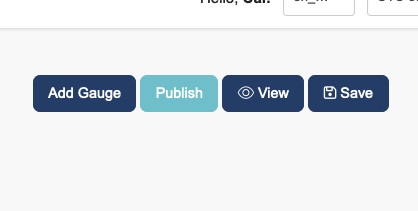
Click the Add Gauge button to add a gauge to your dashboard.
-
Type a name for the gauge in the Name text box.
-
Choose a Gauge Type from the drop-down list. The gauge type will determine the remaining fields to complete within the dialog box.
-
Complete the remaining fields in the New Gauge dialog box.
Most graph types will require you to identify:
-
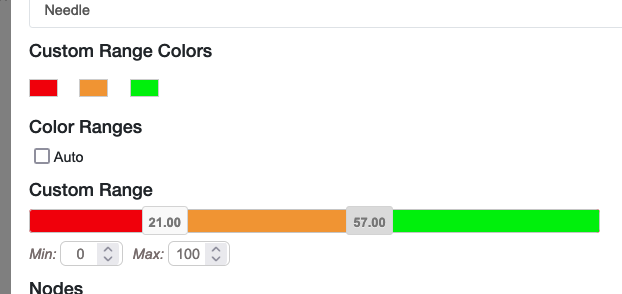
Color Ranges allowing you to display custom color backgrounds by range of readings to easily see any nodes exceeding their expected range.
-
Uncheck the auto box if you wish to customize the ranges.
-
Slide the values boxes to differentiate desired color ranges
-
Modify the mix/max values of the range as desired
-
-
Monitoring node from the Node drop-down list.
-
Channel for the gauge from the Channel drop-down list (e.g., Cost)
-
Time period you want to measure from the Chart Time drop-down list (e.g., 24h for 24 hours)
-
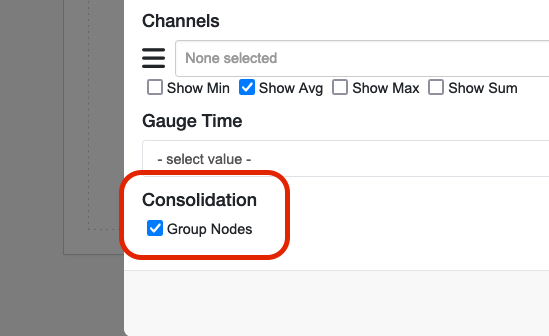
Select min, avg, or max check box(es) under the Values section to capture the minimum, average, or maximum readings in a time period (i.e., choose 24h and minimum to display the lowest reading for each hour over 24 hours)
-
Consolidate individual nodes under the Consolidation section for times when you don't need to display individual node data points. Check the Group Nodes box. The chart will automatically calculate new min/max/avg values.
-
Click the Add button to add the new gauge to the dashboard.
-
Repeat this process to add additional objects to the dashboard.
-
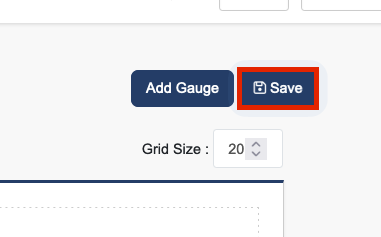
Click the Save button in the dashboard top menu to retain your additions. You may make additional changes at any time.
Specialty Gauge - Represent Node Alert Status as a Gauge
Node alert status can be represented as a state type gauge.
-
Go to Custom Views > Dashboards find the dashboard to which you wish to add a gauge.
-
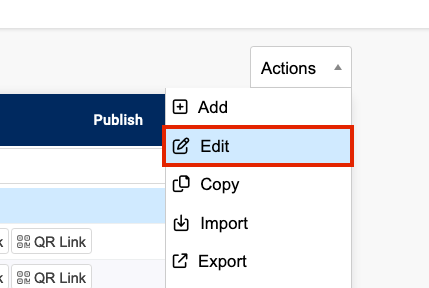
Click the Edit option in the Actions button.
-
Click the Add Gauge button.
-
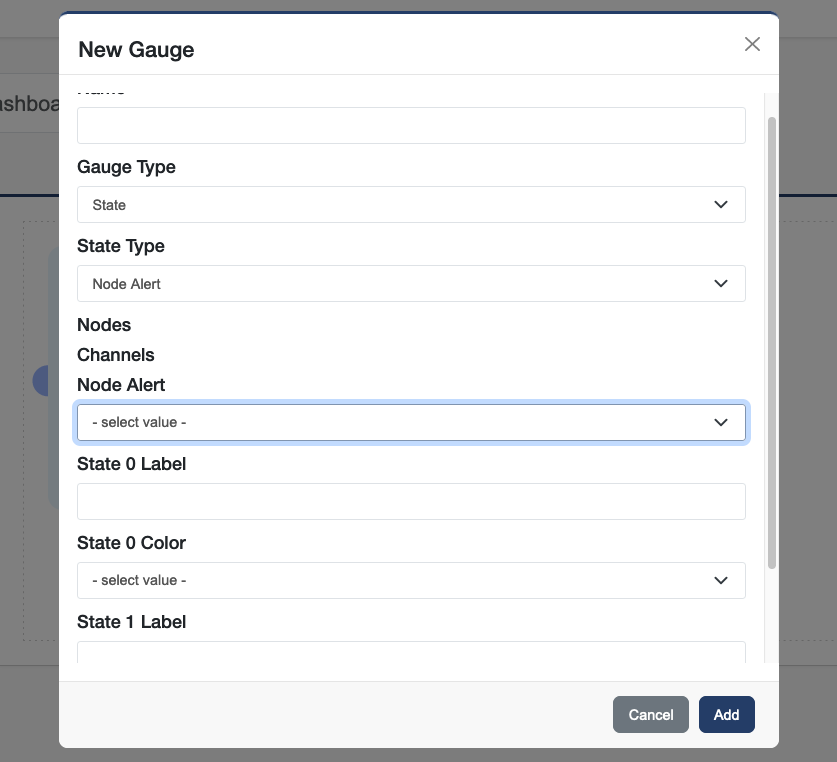
Complete all fields in the New Gauge window.
-
Name: the gauge label that will appear in the dashboard
-
Graph Type: Choose State from the drop down box
-
State Type: Choose Node Alert from the drop down box
-
Node Alert: Select from the list of existing node alerts
-
State 0 Label: State 0 refers to the operating status when the alert is not triggered, the label should reflect that operating status; e.g. "Cabinet Closed"
-
State 0 Color: Choose one of the gauge colors
-
State 1 Label: State 1 refers to the operating status when the alert is triggered, the label should reflect that operating status; e.g. "Cabinet Open"
-
State 1 Color: Choose an alternative color from State 0 to draw attention to the gauge if an alert is triggered
-
-
When finished, click the Add button
-
Position and size the new gauge as desired following the Positioning Charts within a Dashboard instructions below.
-
Click the green Save button in the dashboard top menu to save the updated dashboard.
Duplicating a Gauge
-
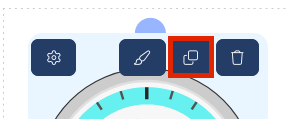
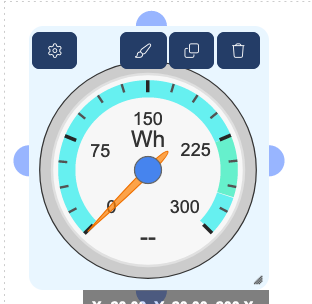
While in edit mode, hover over the desired gauge.
-
Click the copy button for the gauge you want to duplicate.
-
Your duplicate will appear on your dashboard with a “- copy” suffix.
Deleting a Gauge
-
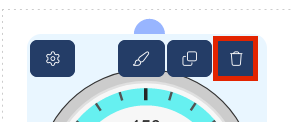
While in edit mode, hover over the desired gauge.
-
Click the delete button within the gauge you want to delete.
Publishing a Gauge
To create a public read-only URL to the dashboard:
-
click Publish in the Dashboard top menu.
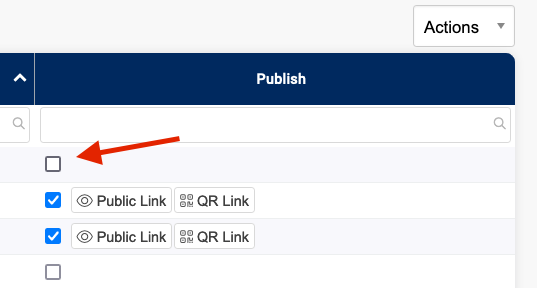
Or, within the edit mode for your dashboard, click the publish button.
Duplicating a Dashboard
-
Choose Custom Views → Dashboards from the left navigation bar.
-
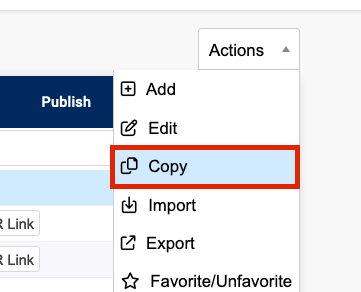
Click the Copy option in the Actions button for the dashboard you wish to copy.
-
Rename the dashboard as desired.
Editing a Dashboard
-
Go to Custom Views → Dashboard and find the dashboard to which you wish to add a gauge.
-
Select a dashboard and click the Edit option in the Actions button for the dashboard you wish to edit.
-
Make the desired changes and click the Save button when you are done. You may always make additional changes at another time.
Editing an Existing Gauge
-
Click the Edit button within a specific dashboard.
-
Hover over a gauge to reveal the edit buttons. You can edit settings, change styling, copy, or delete a gauge. click the save button when done.
-
Click the green Save button in the dashboard top menu to retain your modifications. You may make additional changes at any time.
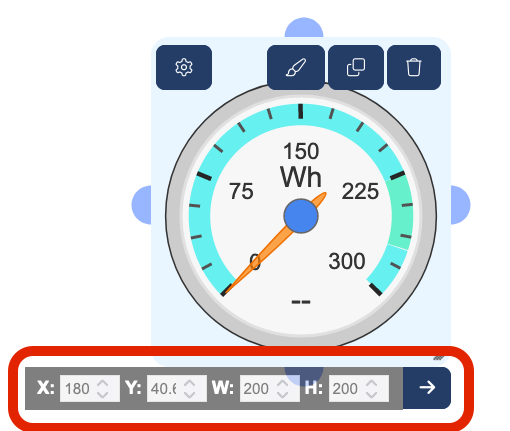
Positioning Charts within a Dashboard
You can position gauges and charts within a dashboard by dragging and dropping where desired. You can resize an object by dragging its corner in or out. When you require more granular positioning and sizing you can specify the object's exact X and Y coordinates within the dashboard as well as object pixel size.
Click anywhere in the object to reveal several input text boxes allowing you to edit the object's positioning and size. Update the desired position and size information. Hitting the Enter key after each input will update the object's location/size. Alternatively, you can click the blue arrow within the shaded box to apply changes.
Click the Save button in the dashboard top menu when you are done.
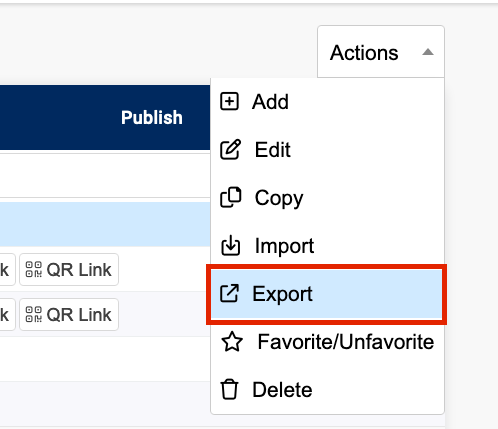
Export Dashboards
-
Select the desired dashboard in Custom Views → Dashboards.
-
Select the Export option under the Actions button.