

Overview
Custom tables are a simple yet powerful mechanism for customizing your EMX account and giving users immediate access to just the data they need. Custom tables provide a tabular summary of selected parameters for a selected set of monitoring nodes. The resulting table can be further sorted and filtered using table header controls.
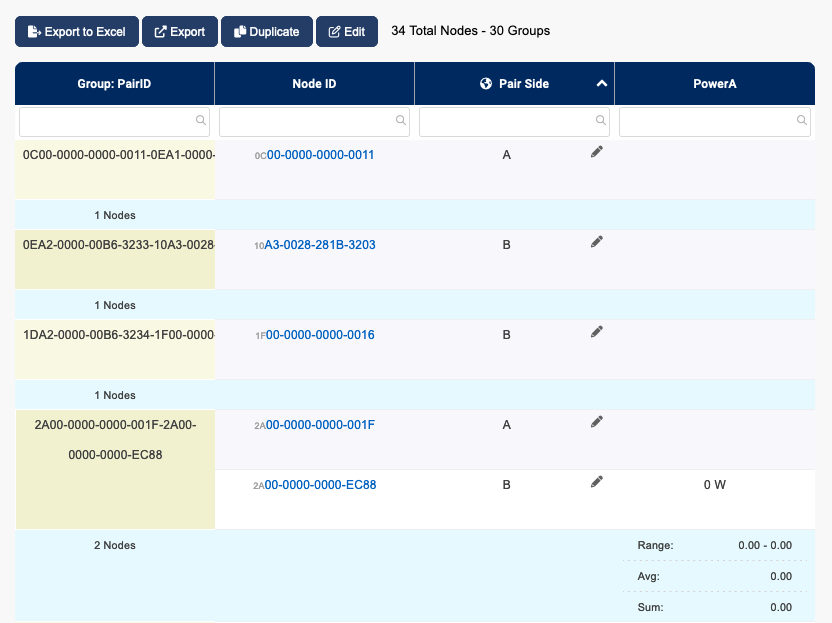
Table elements:
-
Includes a summary row at the top, indicating the range of values present for the specified parameters
-
Table is sorted in a specified default order
-
The table can be resorted by clicking on the column headers
-
Data can be filtered by entering filter values in the header filter boxes
Creating a custom table
-
Go to Custom Views > Tables
-
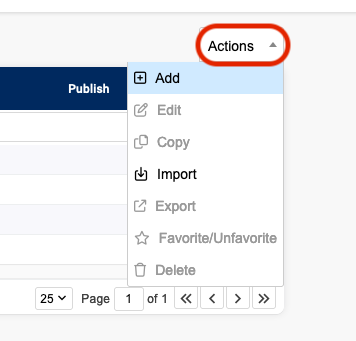
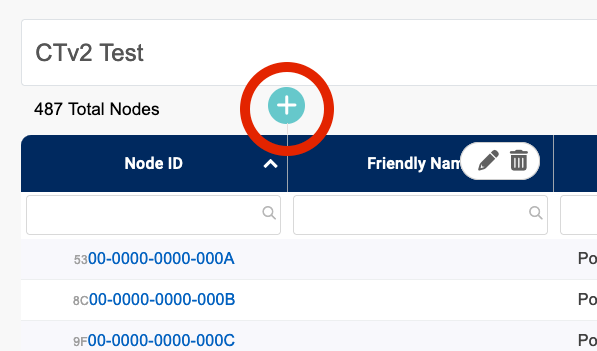
Click on the add option under the action button
-
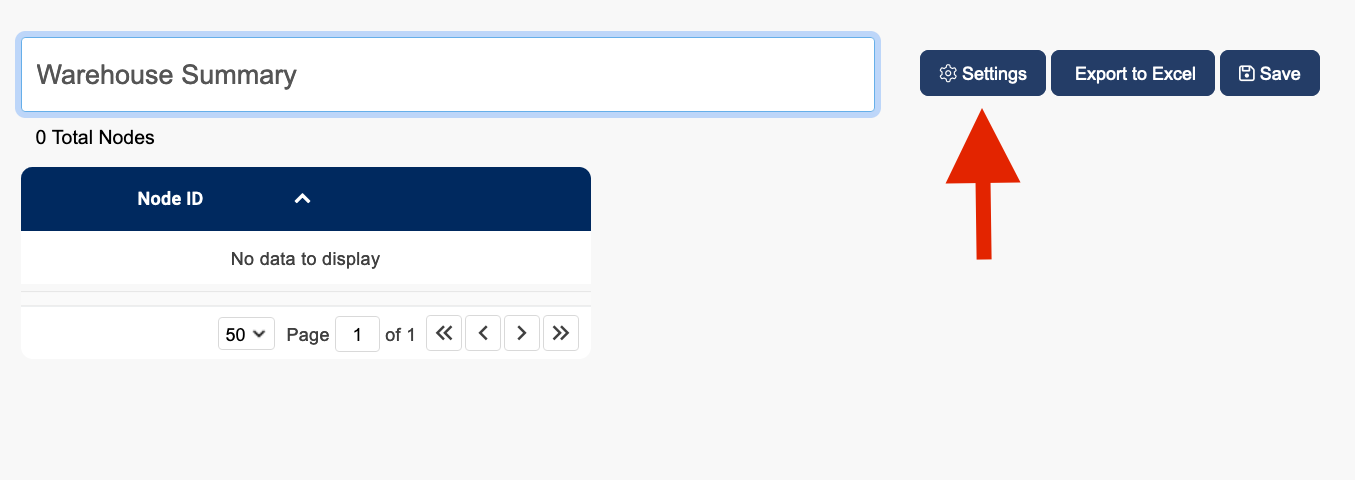
Enter the name of your table and click the Settings button to open the Settings window.
-
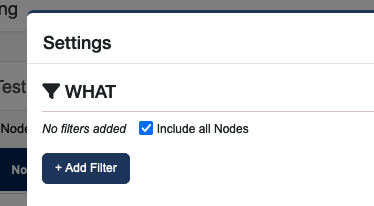
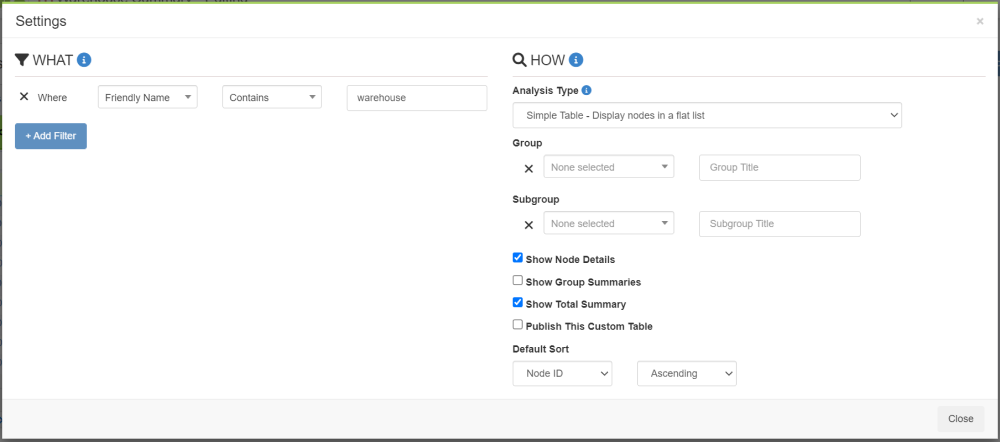
In the Setting window, use the WHAT section to indicate what monitoring data you want to include in the table.
-
Click on the + Add Filter button to display a drop down of options to include/exclude nodes. You may add as many filters as desired. In this example we want to include any nodes containing the word "warehouse east" in the friendly name.
-
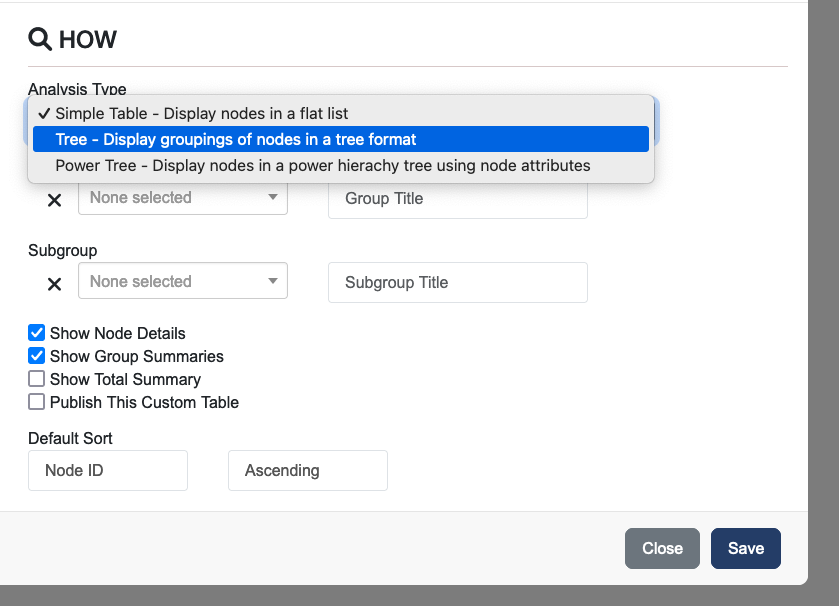
In the Settings window, use the HOW section to define how data is displayed in the table.
The Analysis Type drop down menu gives you three different display organization options.-
Simple Table - Displays the information in a table made up of columns and rows.
-
Tree - Display groupings in a tree or hierarchical layout.
-
Power Tree - Displays nodes in a power hierarchy tree using node attributes
-
-
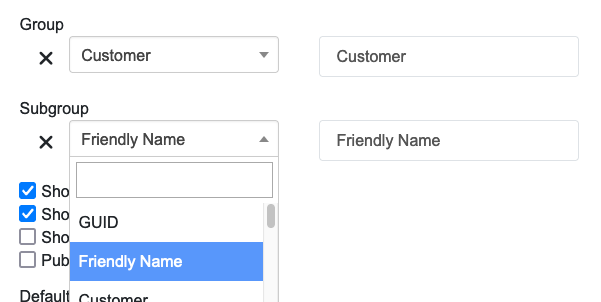
Group and Subgroup settings allow you to group data by up to two different attributes. Select your primary grouping attribute from the dropdown menu. Do the same for Subgroup as desired.
-
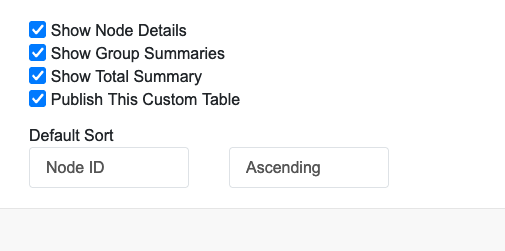
Review the additional display options and check the boxes for options you wish to use.
-
Show Node Details - Displays more detail about the nodes (you'll generally want to check this to see useful data in your table)
-
Show Group Summaries - Displays a group summary row at the top of each group
-
Show Total Summary - Displays a summary row at the top of the table indicating key statistics (min, max, avg) for each column
-
Publish This Custom Table - Makes the table available to share with others
-
-
Use Default Sort to identify how you want data to be sorted automatically. Until you add more columns, your only option will be Node ID. Once additional columns have been added, you can update the default sort as desired. You can also sort data by clicking on a column heading in the actual table. Note that this method doesn't change how the table automatically sorts.
-
Click the Close button to see the initial table view.
-
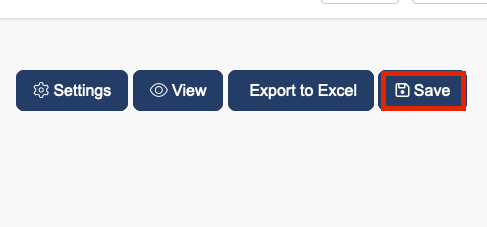
Click Save to save your work so far.
-
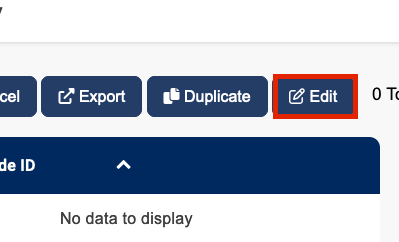
Click Edit to continue refining your table.
Adding columns
-
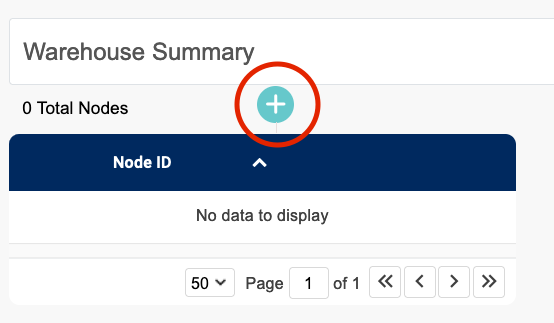
While in edit mode, hover your mouse over the Node ID column. A plus sign will appear. Click on the plus sign to open the Add Column window.
-
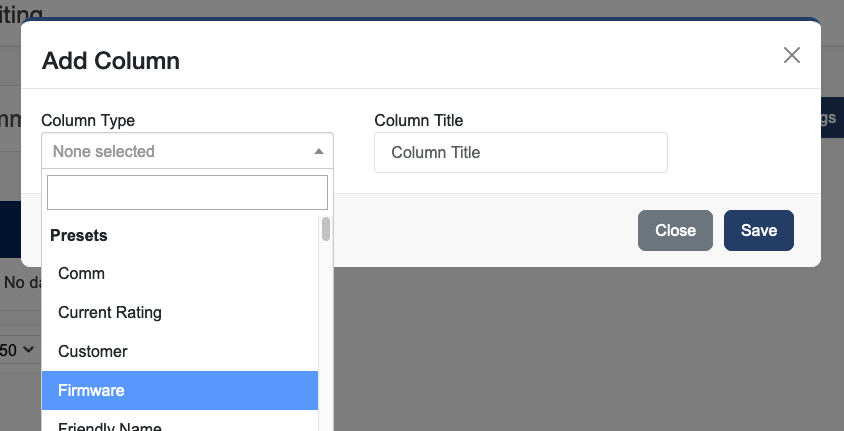
Select the information you want to include from the dropdown box and click Save.
-
Repeat this process to add more columns. Remember to click the green Save button to save your additions.
Duplicating a custom table
Rather than creating a new custom table from scratch, you can duplicate an existing custom table that has similar data and edit it.
-
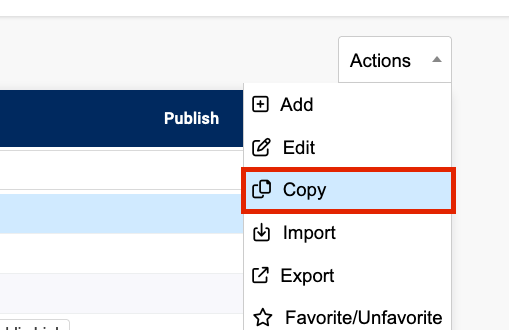
Go to Tables and find the custom table you wish to duplicate and click the Copy option under the actions button.
-
A new table will be created with the original name and " - Copy" after it. Rename the table and Save your results.
-
Then follow the instructions to edit a custom table.
Editing a custom table
You may edit a custom table at any time.
-
Go to Tables and find the custom table you wish to edit and click the Edit option under the actions button.
-
Click on Settings to update:
-
What data to include using Filters
-
Table layout using Analysis Type
-
Whether or not to Group (and Subgroup) content and by what parameters
-
Additional display options
-
-
Click Close when changes have been made.
-
Add additional columns by hovering your mouse over the column where you'd like to add a new column to the right. A plus sign will appear.
-
Click on the plus sign to open the Add Column window.
-
Select the information you want to include from the drop down box and click Save.
-
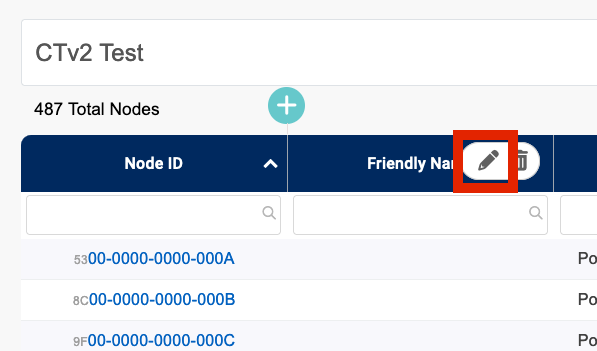
Edit an existing column by hovering over the column you wish to edit.
-
Click on the pencil graphic to open the Edit Column window.
-
Select the new data in the Column Type dropdown menu and click Save.
-
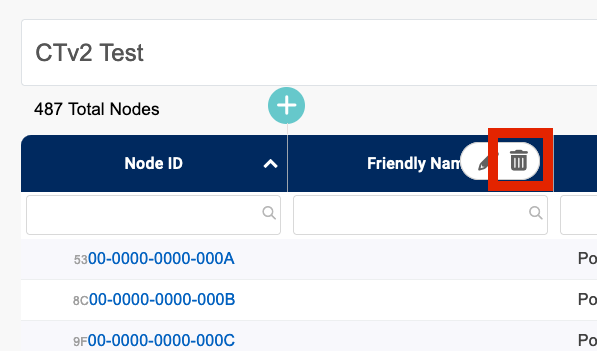
Delete an existing column by hovering over the column you wish to remove. Click on the trash can graphic to delete the column.
-
Be sure to click the blue Save button to save your changes.