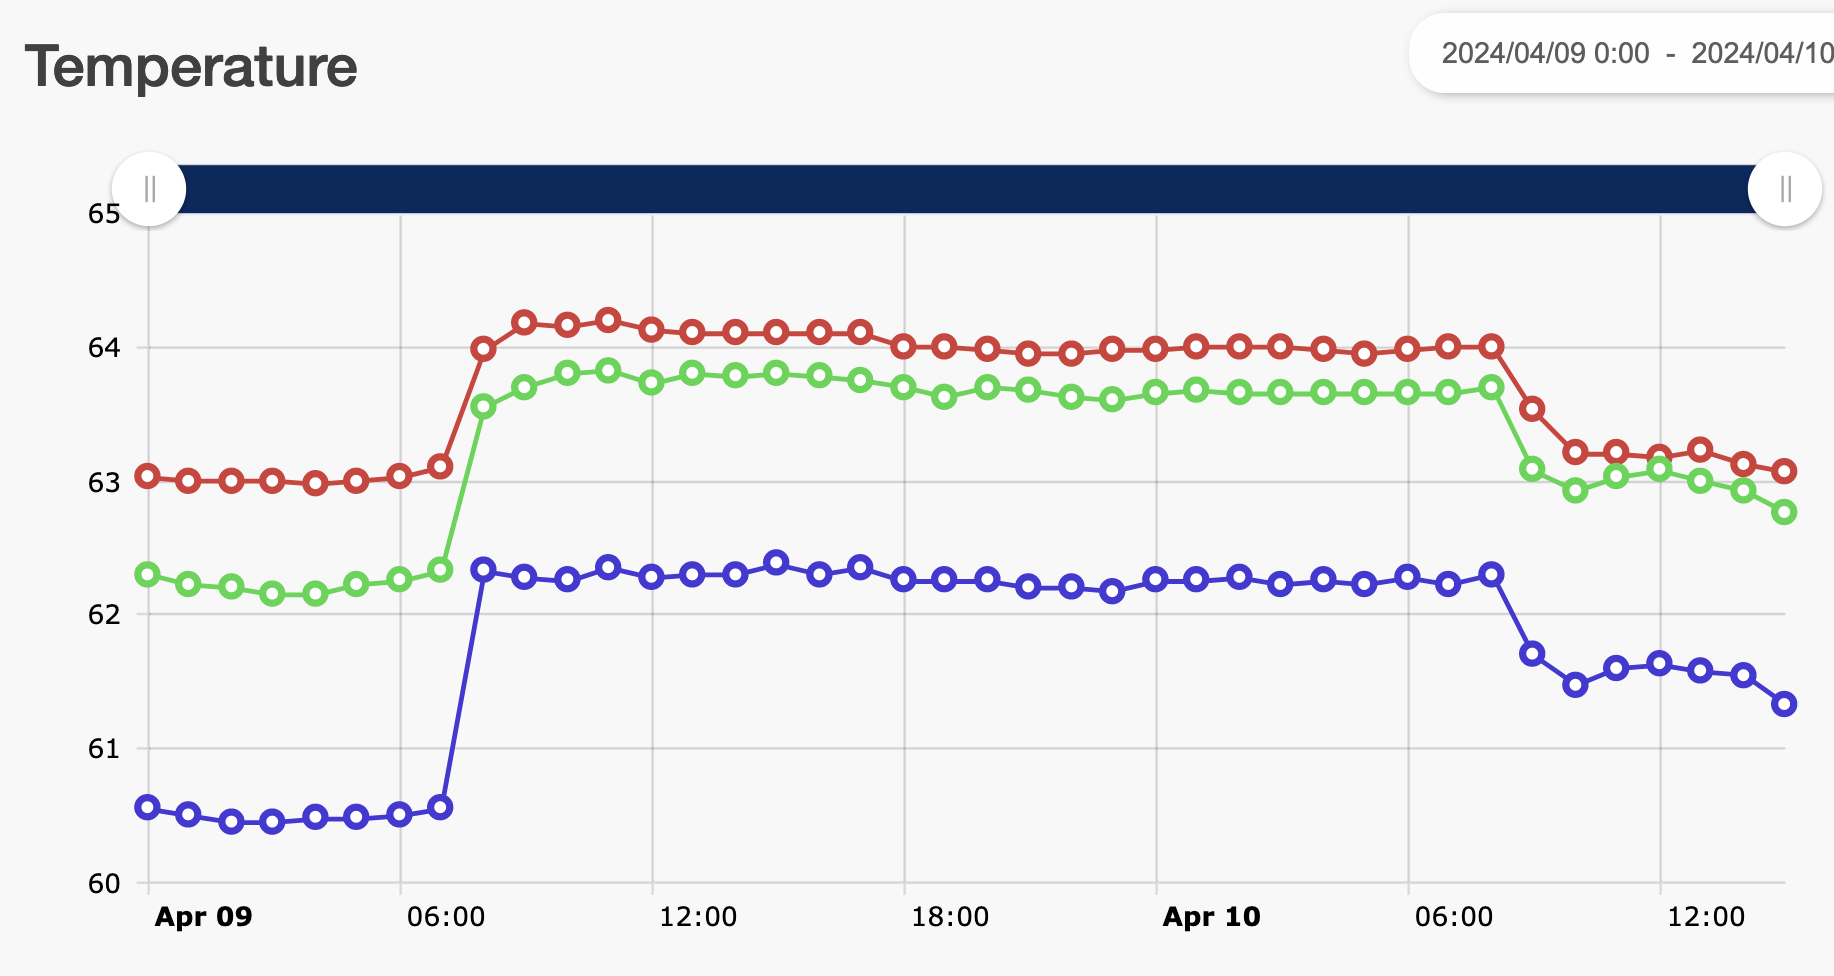
Environmental monitor readings are available in several places:
-
Most recent readings
-
Detailed and historical readings
Most recent readings from Home
From Home, scroll down the page to the Environmental Monitors table displays the most recent data for each environmental monitoring node. If no data has been received within the last 15 minutes, the reading is blank.
-
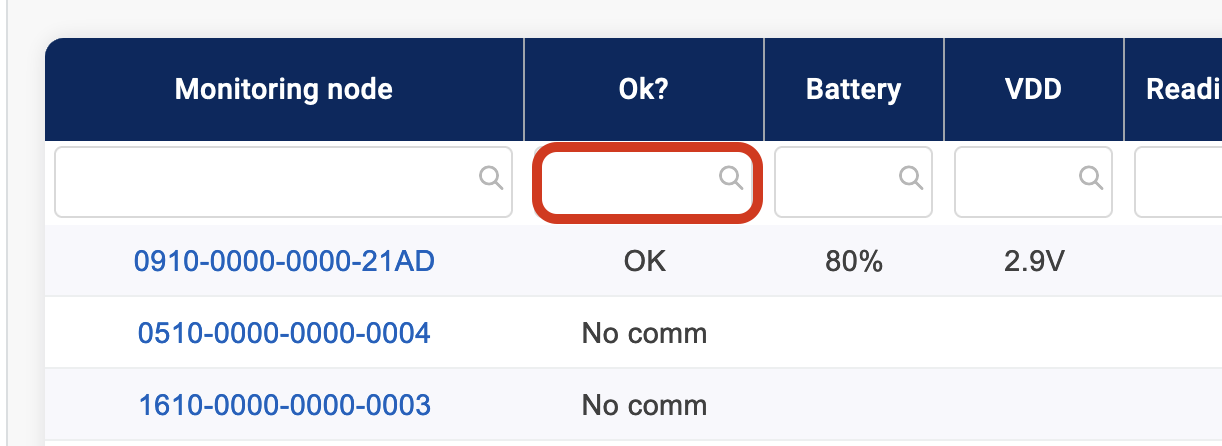
Search for an item by clicking in the empty cell below the column header and then typing the entry for which you want to search.
-
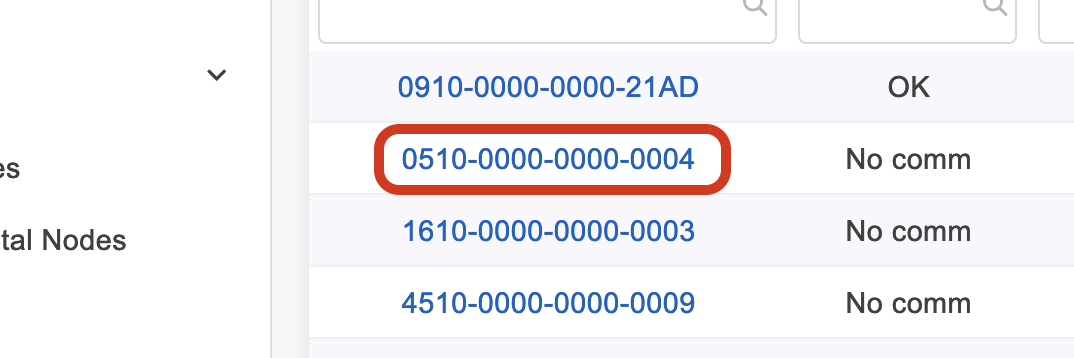
Click a 16-digit node number to view its detail page. See “Viewing a Node's Details” below for more information.
-
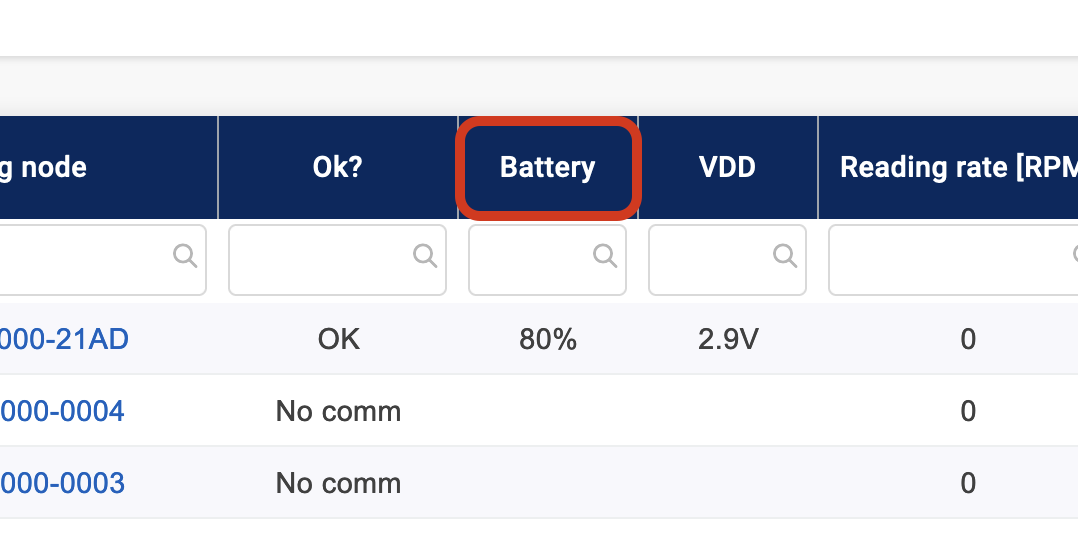
Sort a column by clicking the column header (e.g., Monitoring Node or Battery).
-
Move to the next or previous page by clicking the arrows at the bottom of the table.

Most recent readings from Standard Views > Environmental Nodes
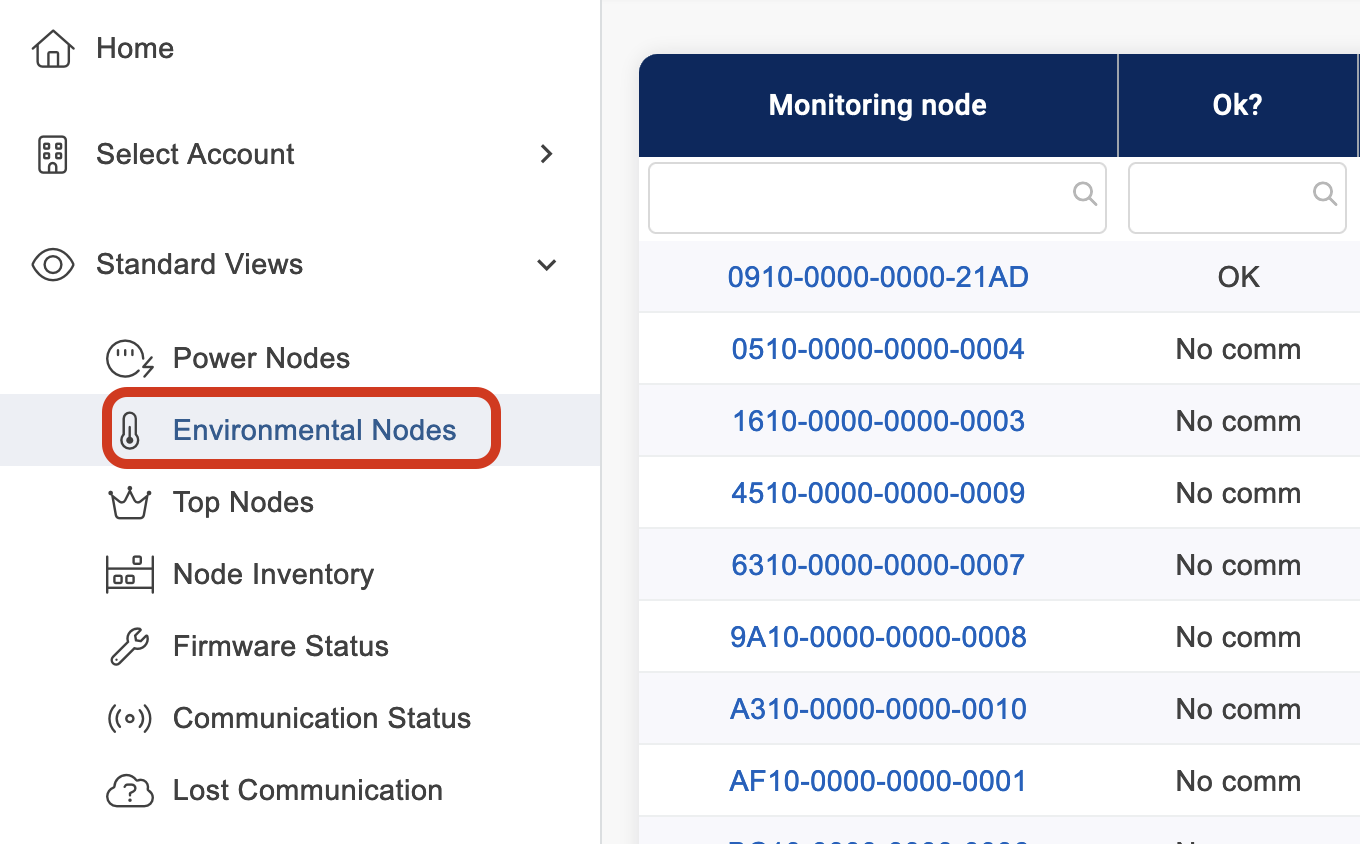
View recent environmental monitor readings by going to Standard Views > Environmental Nodes. This standard report provides slightly different information than the recent readings on Home including the addition of communication status (Ok?).
Node inventory from Standard Views > Node Inventory
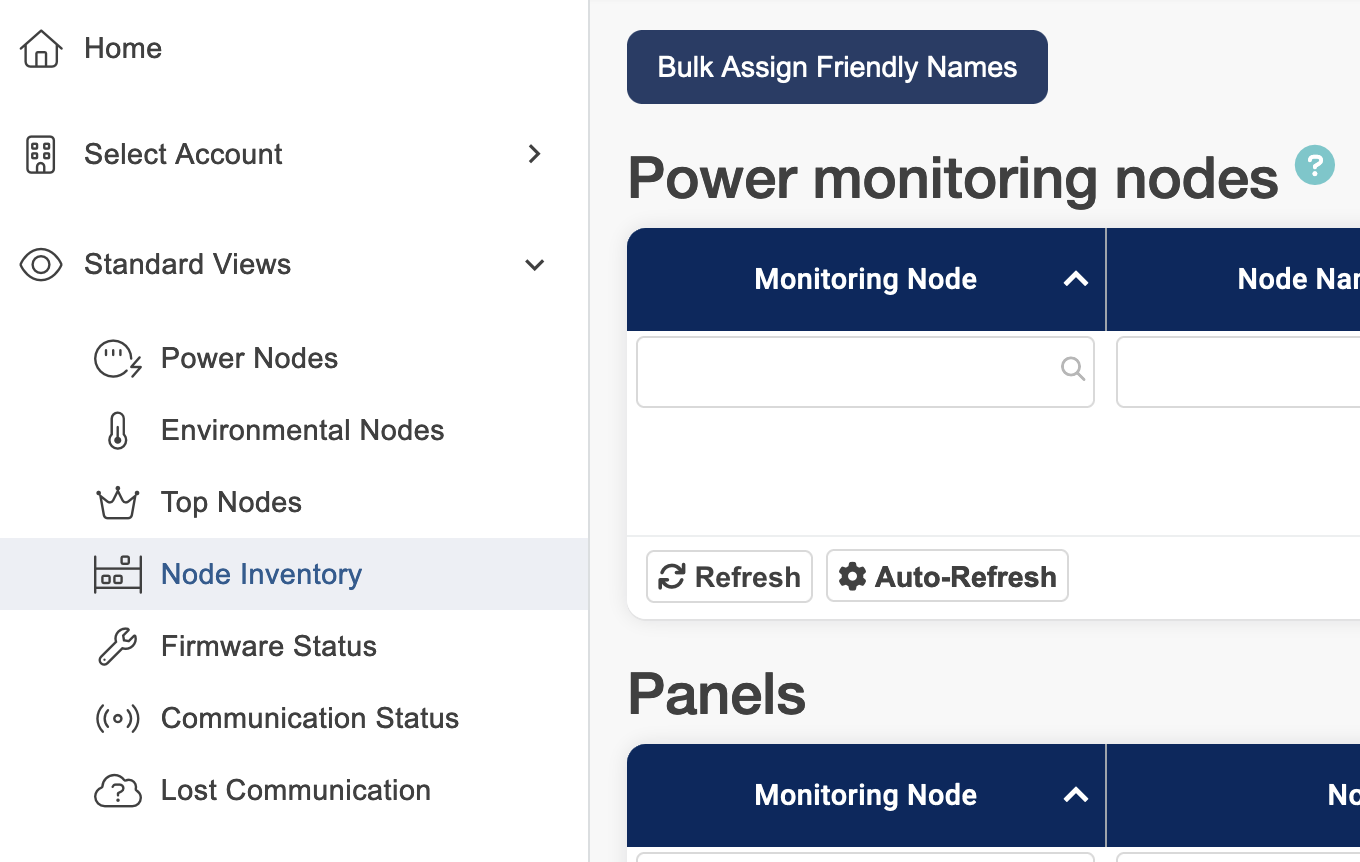
View the list of environmental monitors assigned to your account by going to Standard Views > Node Inventory. This table lists the units assigned to your account, the friendly node name, current communication status, model, EMX license type, and device firmware.
Note: If you are missing monitoring nodes that you think should be assigned to your account, please contact Support at support@packetpower.com or your local Packet Power system administrator.
Viewing a Node's Details
Click a monitoring node's ID number or friendly name to view its detail page from any of the reports listed above.
-
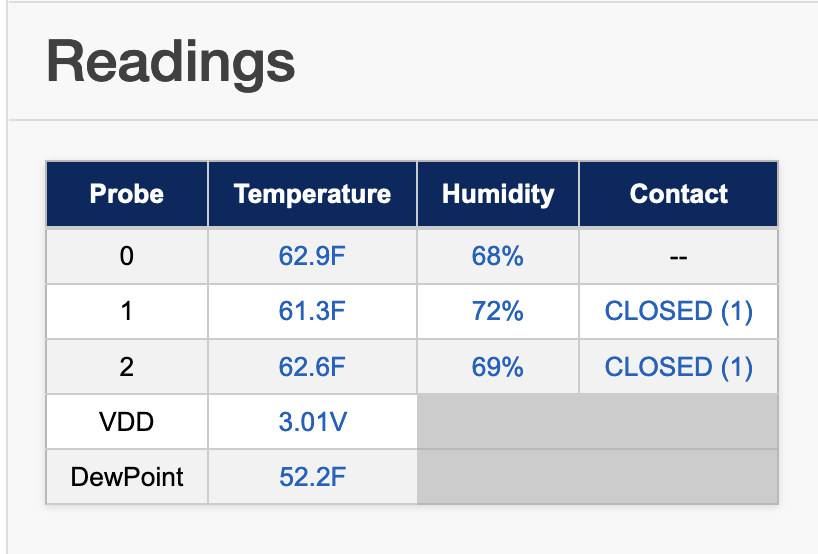
The table at the top of the node detail page show real-time data.
-
Select the time frame for which you'd like to view data from the drop down list.
-
Hold your cursor over a spot in the graph to view an exact measure of power for that particular date and time. You can also click and drag a portion of the chart to zoom in on that time period.
