
-
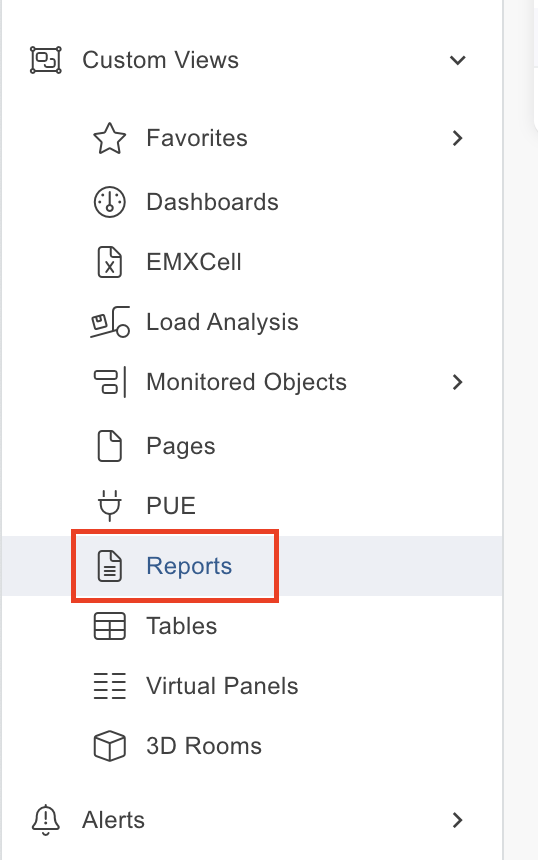
Select Custom Views > Reports from the left navigation bar.
-
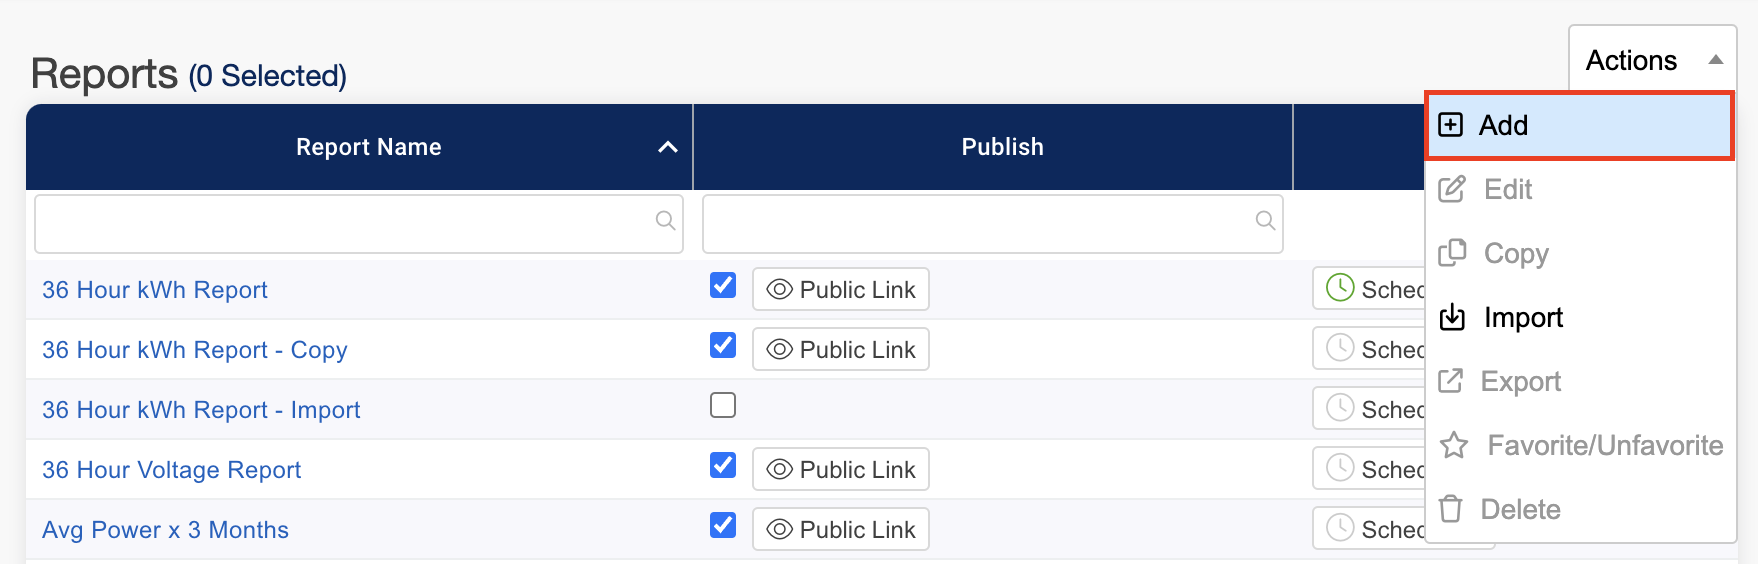
Click the Actions dropdown then click + Add.
-
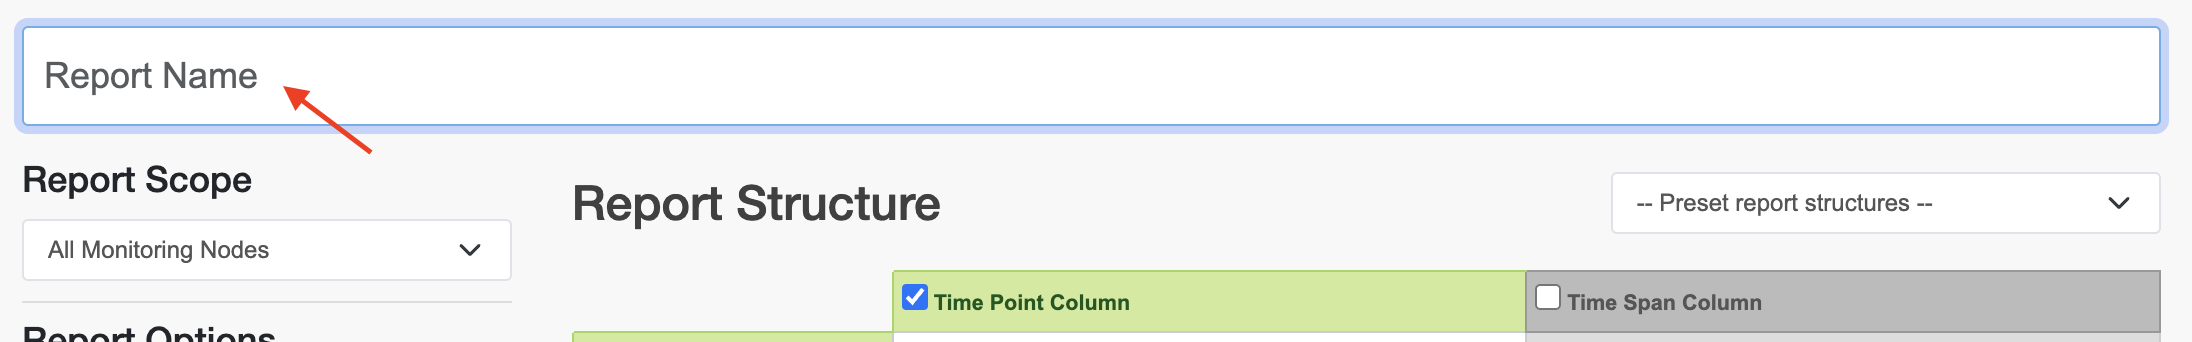
Add a Report Name.
-
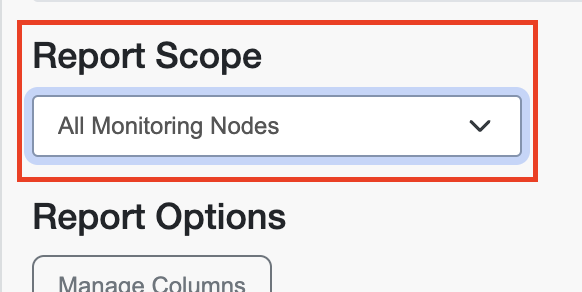
Select the content for your report using the Report Scope drop down list.
-
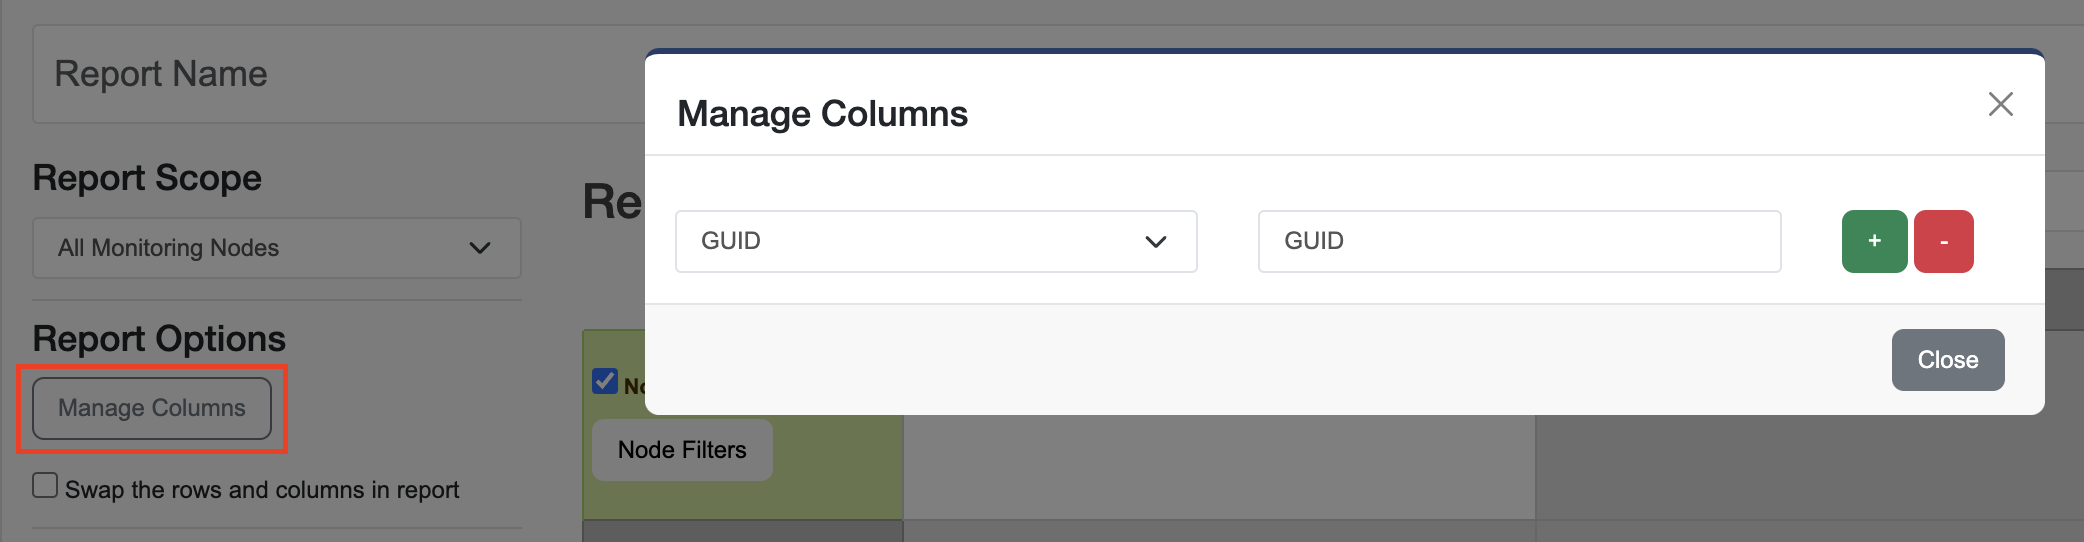
Identify how you want data to be displayed using the Report Options section.
a. Click on Manage Columns to open the Manage Columns Modal to add and remove columns.
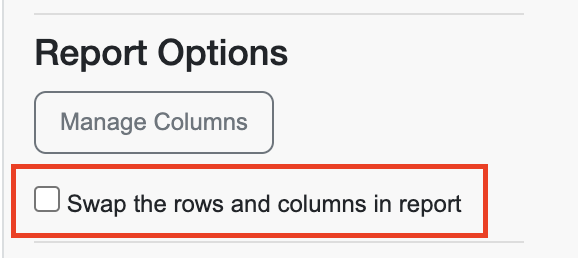
b. Swap the rows and columns in report checkbox.
-
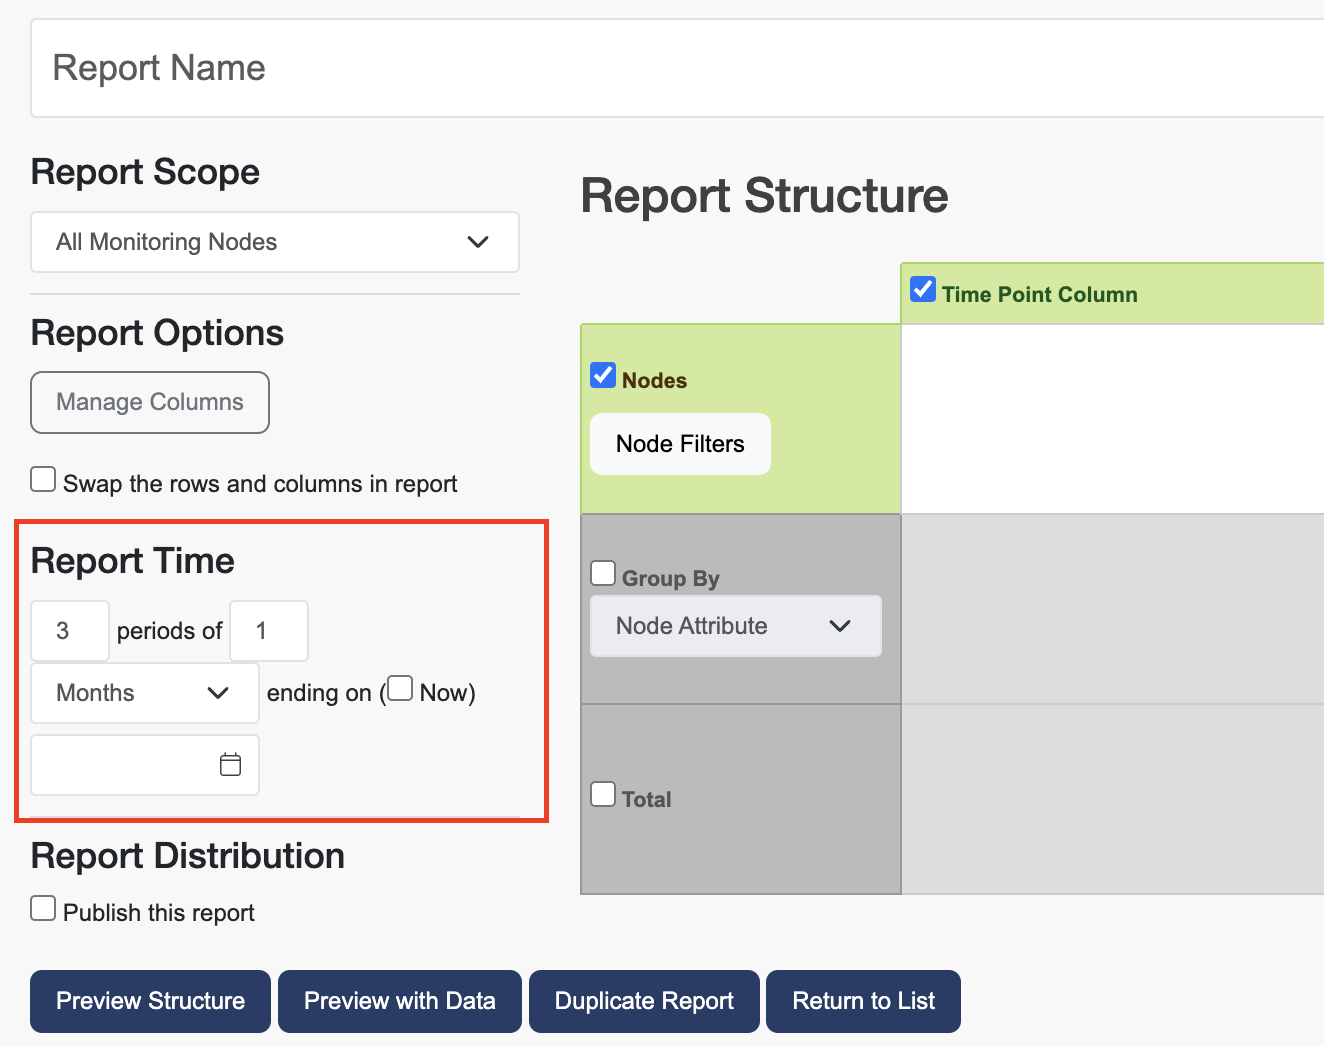
Specify the time period for your report using the Report Time fields.
a. Type the number of time periods and their length in the text boxes and choose the time period from the drop-down list (e.g., 3 periods of 1 Months each).
b. To specify a report end time, clear the ending on Now check box; click the calendar icon to select a report end date. Chose a report end time from the drop-down list. Note: If you are creating a one-time report, leave the Ending on now check box selected.
-
Use a preset report structure using the Preset Report Structures dropdown menu or create your own structure.
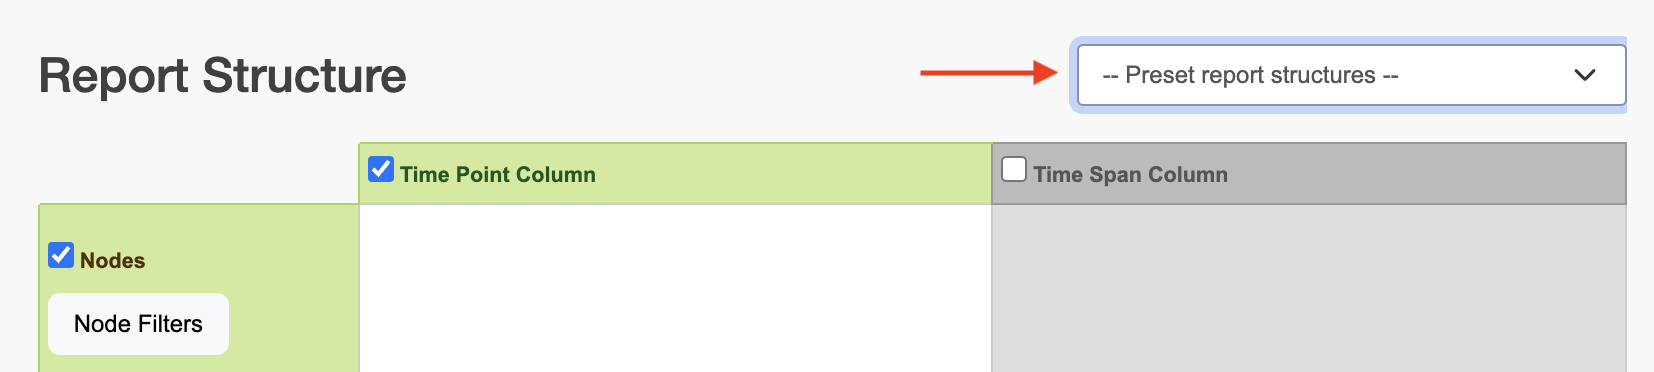
For more information on Preset Report Structures please see: Preset Report Structures.
-
Fine tune the data in your report.
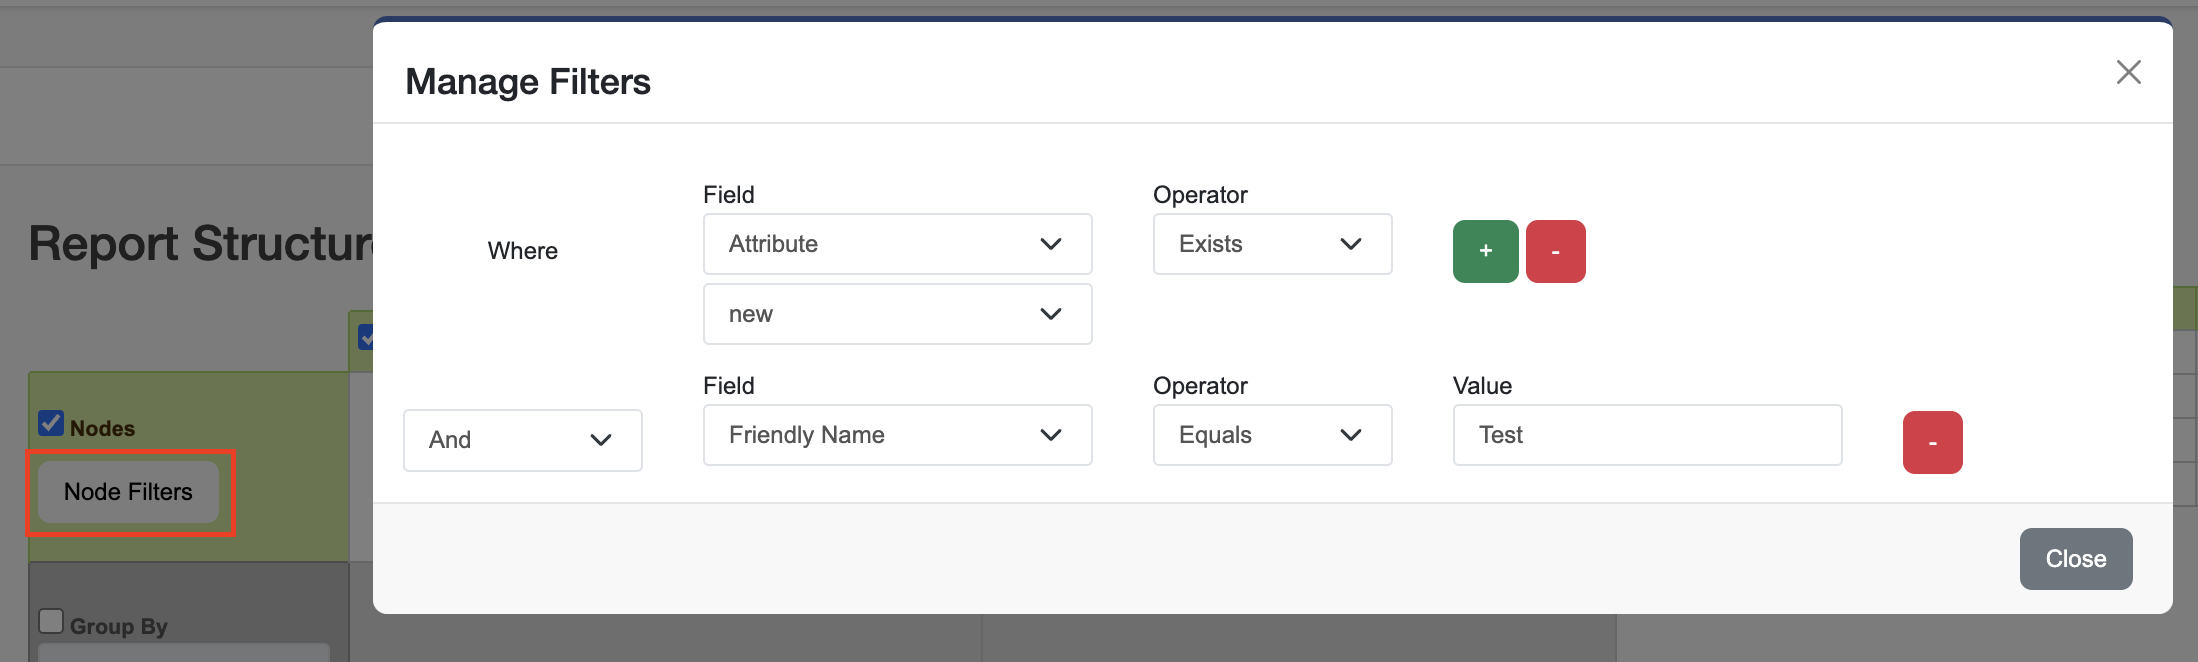
a. Filter nodes displayed in the report by clicking the Node Filters button that opens the Manage Filters window. Add as many filters as desired then click Close.
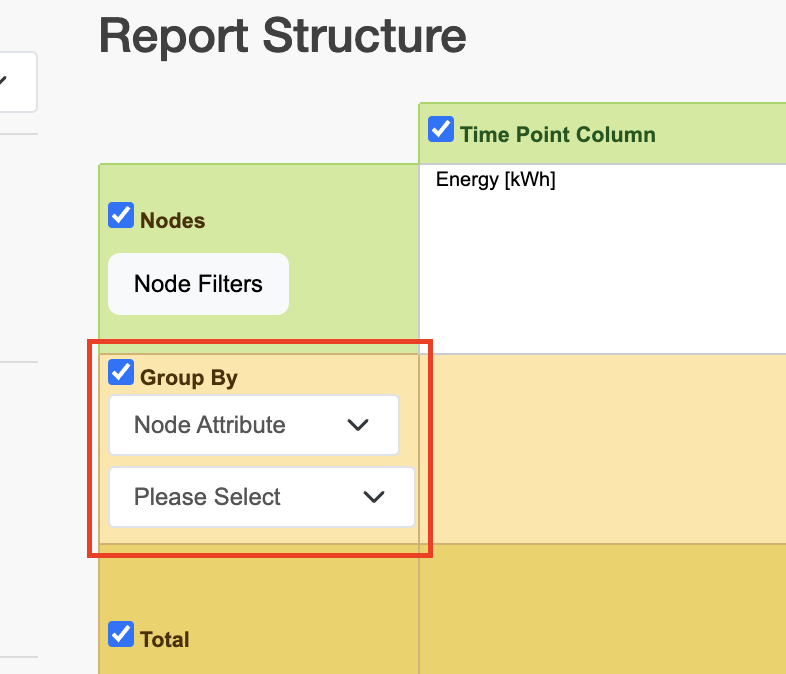
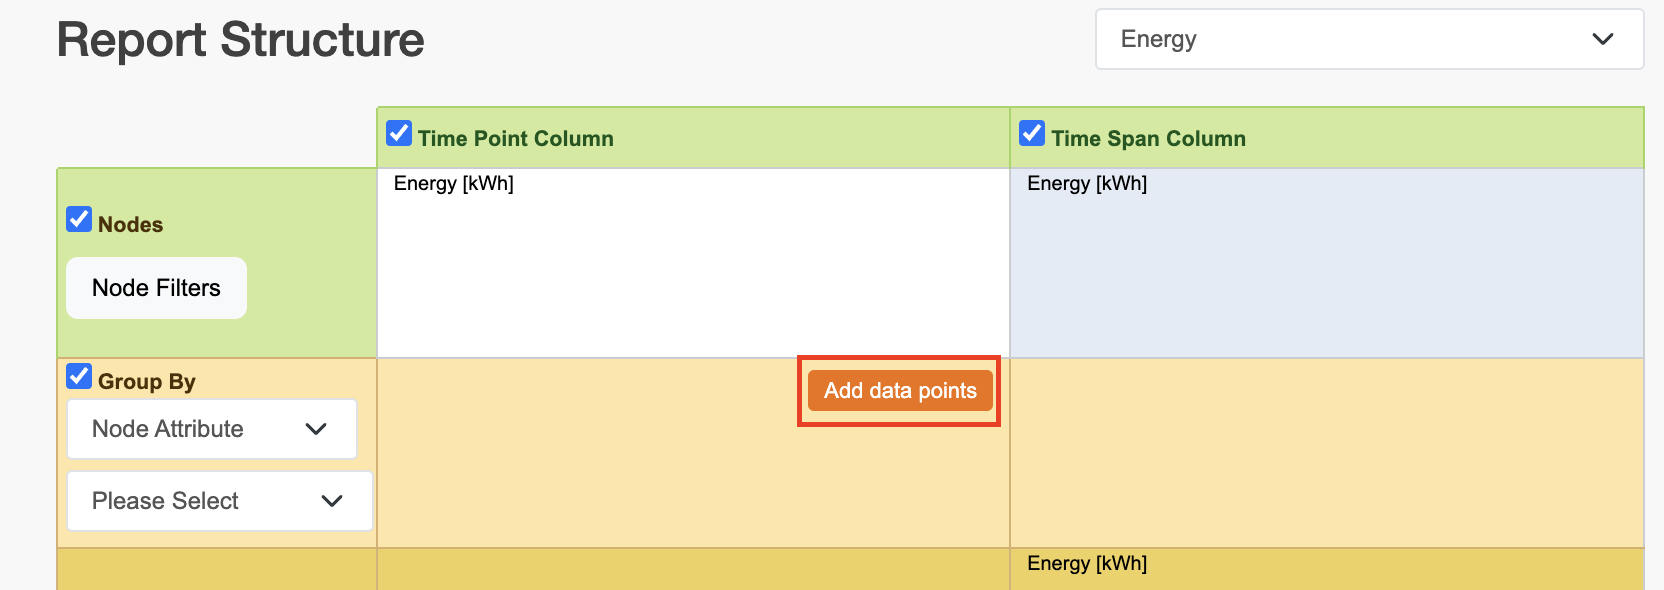
b. Group data in the report using the Group By dropdown menu. A secondary grouping may be available based on the primary grouping selected.
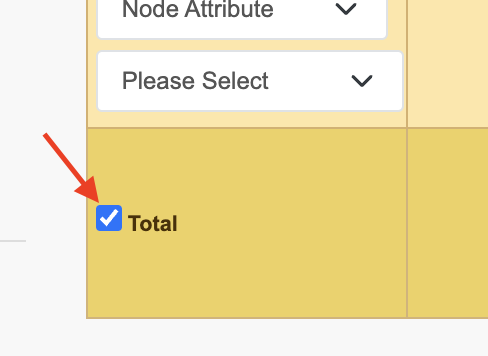
c. If desired, check the Total checkbox to display a report total.
d. Click in the report section to edit the data points to display, or hover in the cell to show the Add Data Points button.
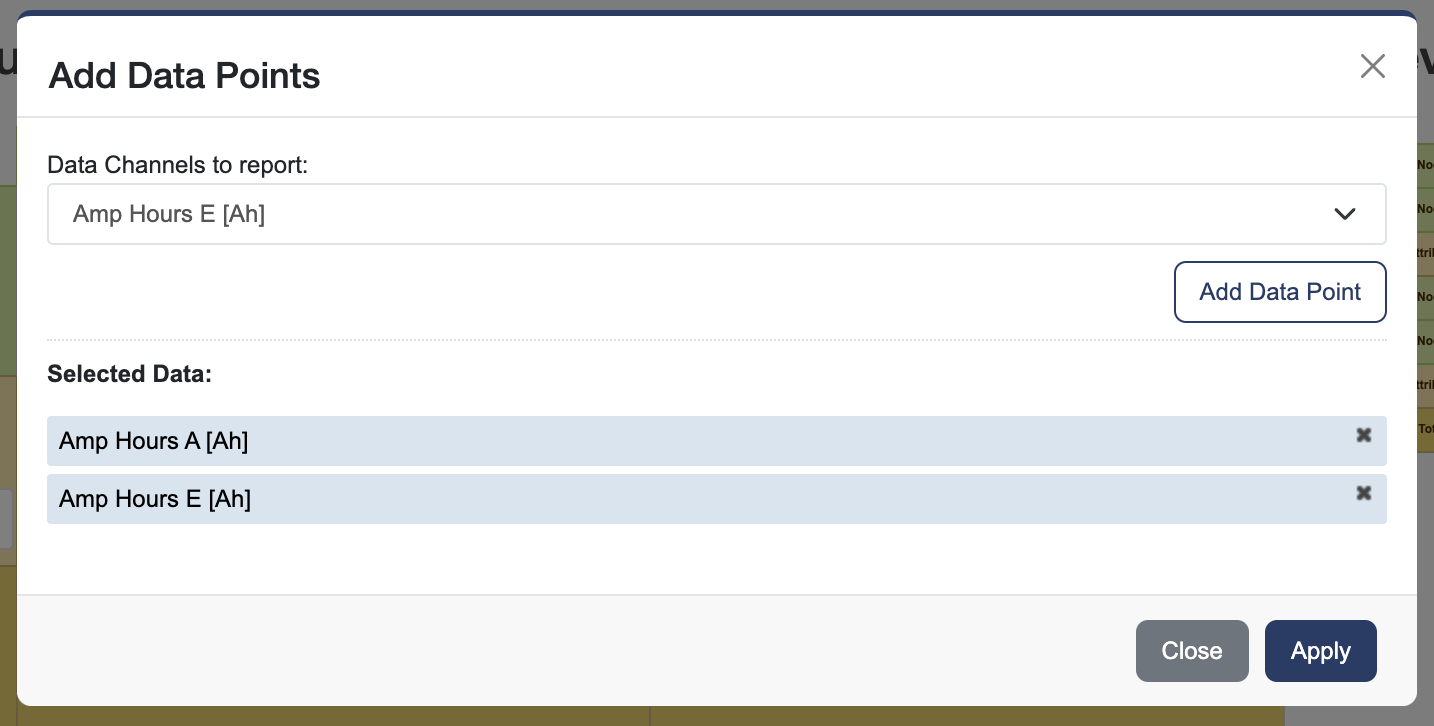
e. Select a Data Channel to report and click Add Data Point. Then you can remove by clicking X or rearrange the order by dragging the Selected Data below. Click Apply to save the changes.
-
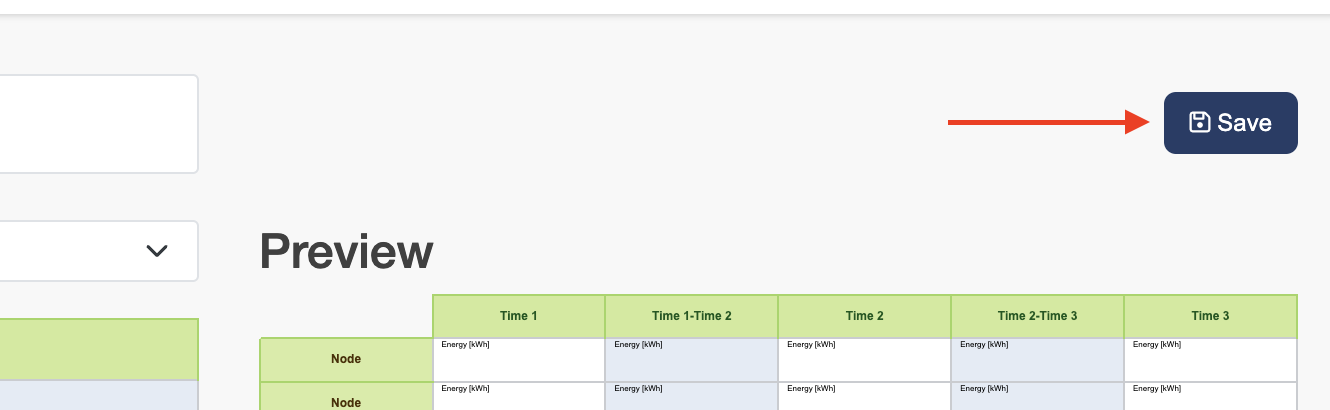
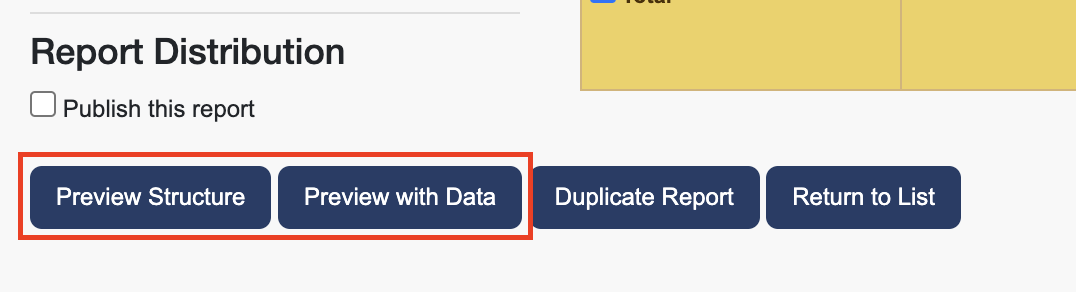
Preview the report using the blue Preview Structure and Preview with Data buttons at the bottom.
-
Save your report.
You must click the blue Save button to save your report, your work is not automatically saved.