

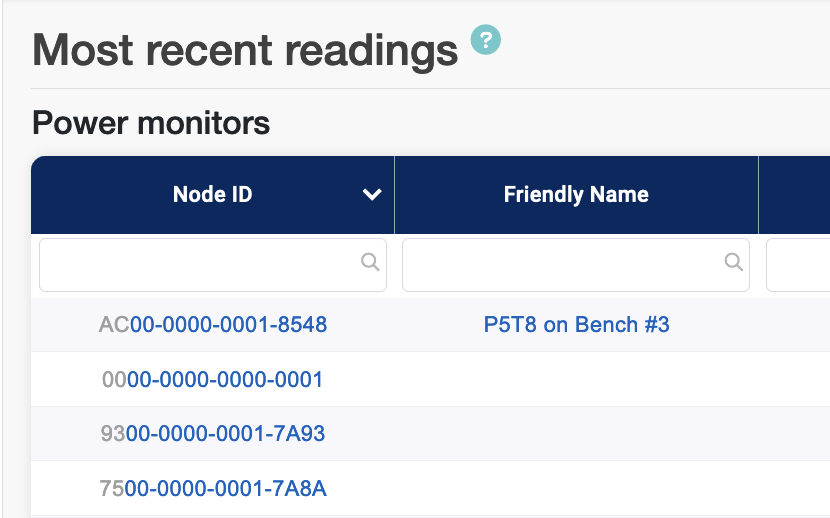
Most Recent Readings Table
The Home page displays the most recent data for each monitoring node. If no data has been received within the last 15 minutes, the reading is blank.
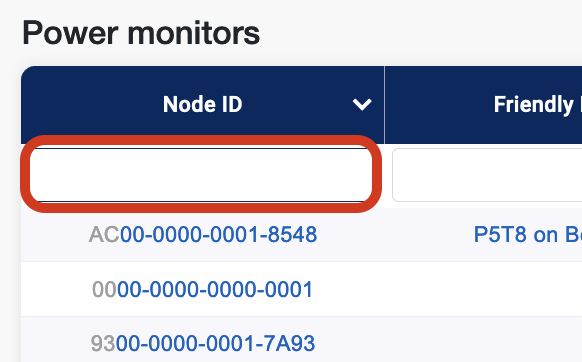
Search for an item by clicking in the empty cell below the column header and then typing the entry for which you want to search.
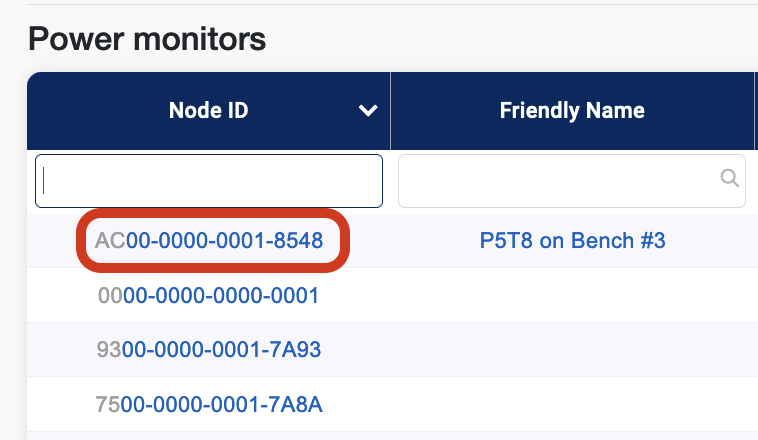
Click a 16-digit node number or it’s friendly name to view its detail page.
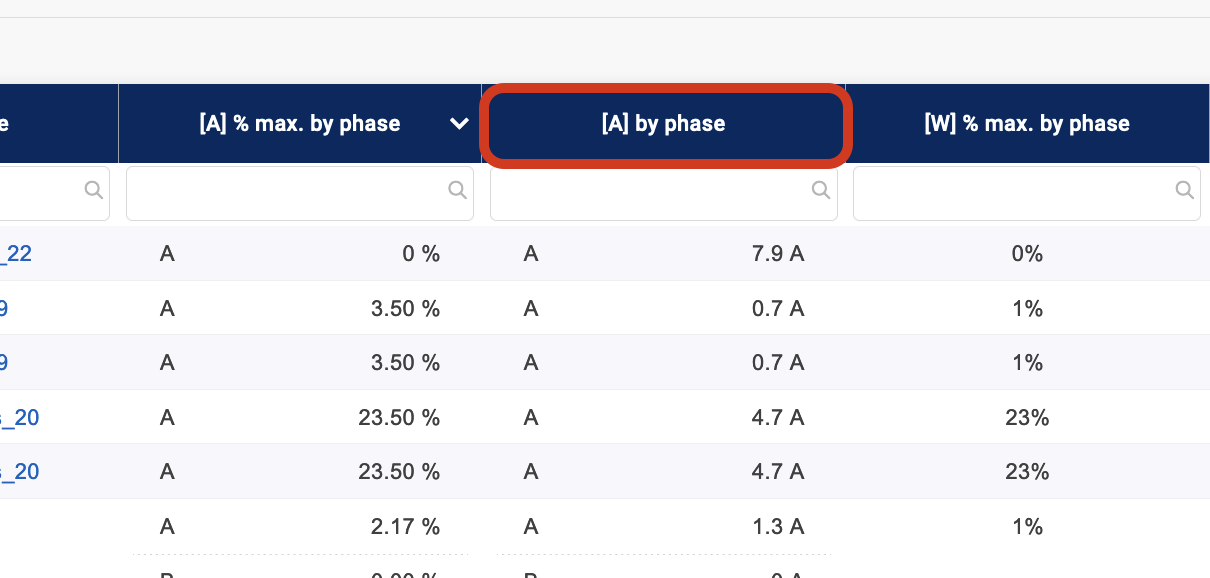
Sort a column by clicking the column header
-
click on "% max by phase" to see the most heavily utilized unit as a percentage of its capacity
-
click on "W total by all phases" to see which unit is drawing the most power
-
click on "Monitoring node" to sort by node number or friendly name. Use the filter box to find certain nodes.
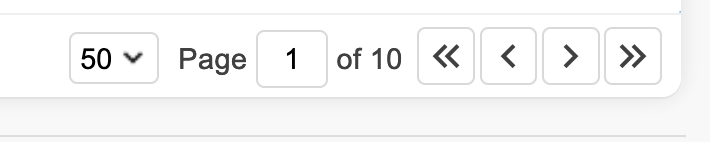
Move to the next or previous page by clicking the arrows at the bottom of the table.
See also: Using Tables.
Power Monitoring Summary
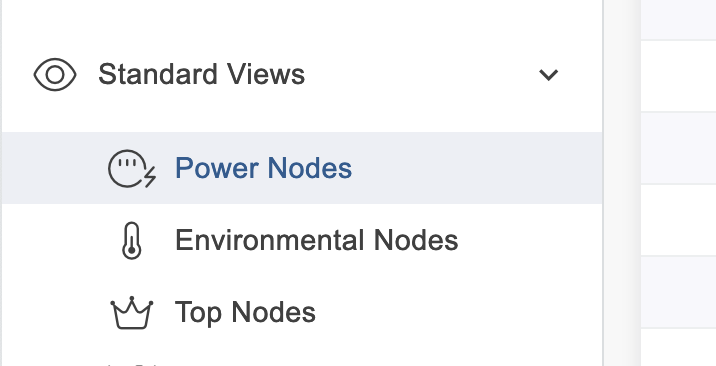
You can access a more detailed report of readings from all power monitors at Standard Views > Power Nodes. Clicking on the column header will sort based on that column. Use the filter boxes to find specific items.
Viewing a Node's Details
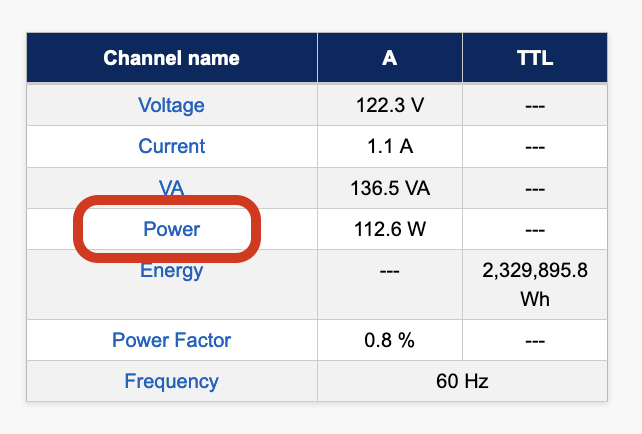
Click a monitoring node's ID number or friendly name to view its detail page. The gauges at the top of the node detail page show real-time data.
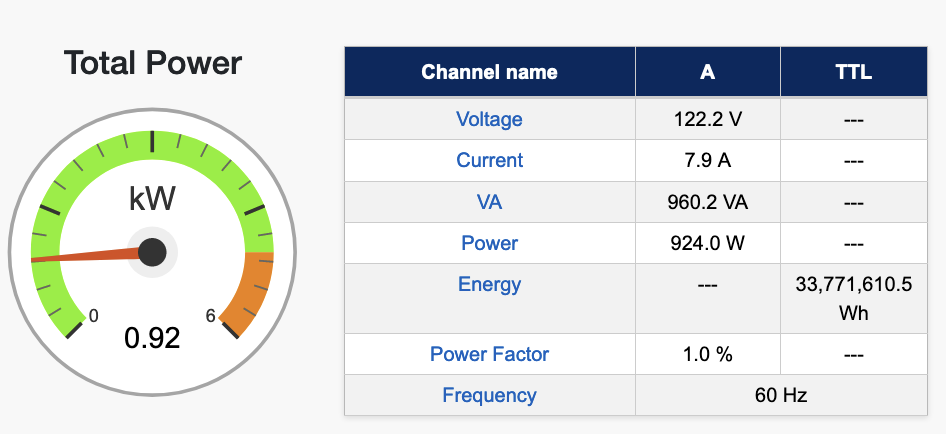
Click a control at the top of the resulting page to view detailed information for that control (e.g., Power).
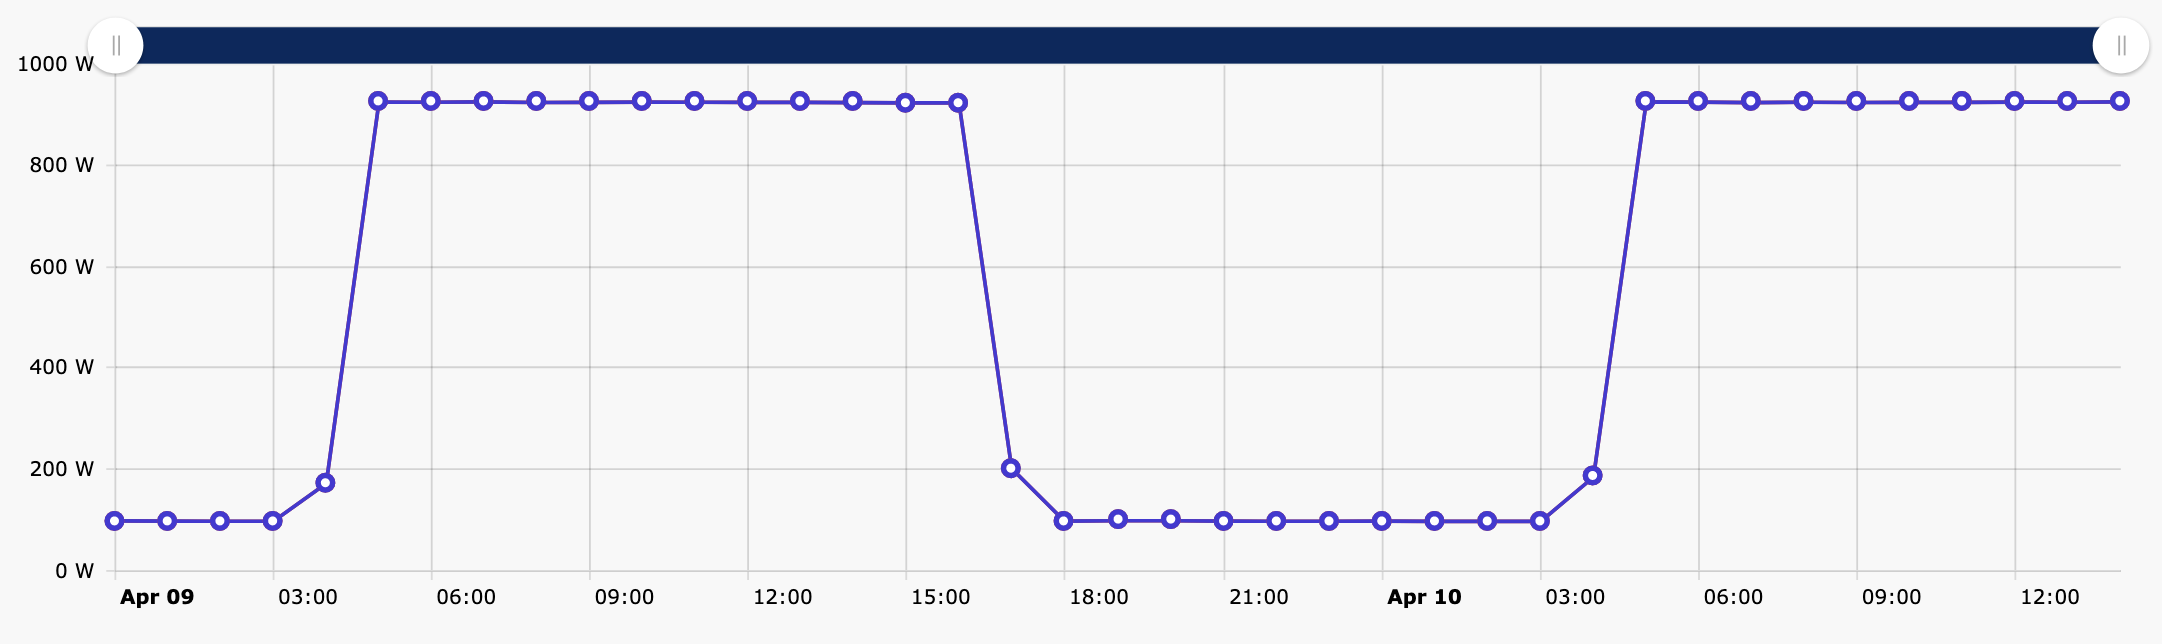
View data by the timeframe of your choice by selecting from the drop down menu at the top right of the table.
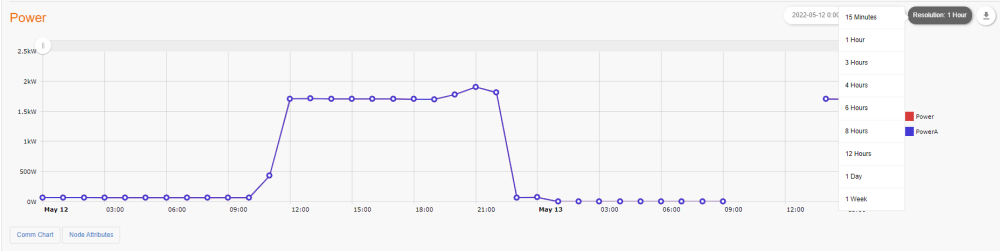
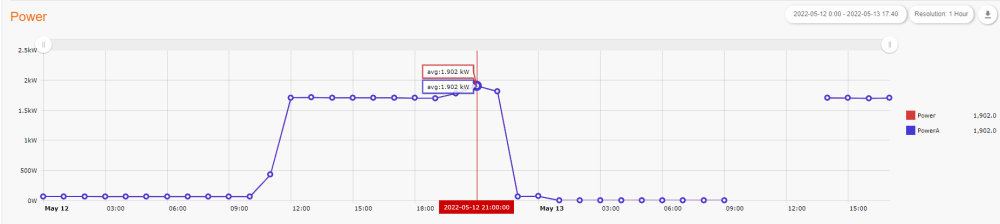
Hold your cursor over a spot in the graph to view an exact measure of power for that particular date and time. You can also click and drag a portion of the chart to zoom in on that time period.
Viewing Temperature Data for Power Cables
-
Click the node ID for which you want to view temperature data on your home page under Power Monitors. Or, choose Analyze/Power from the main navigation bar, and then click the node ID for which you want to view temperature data.
-
Click the monitoring node for which you want to view a temperature reading.
-
Click the Temperature channel.
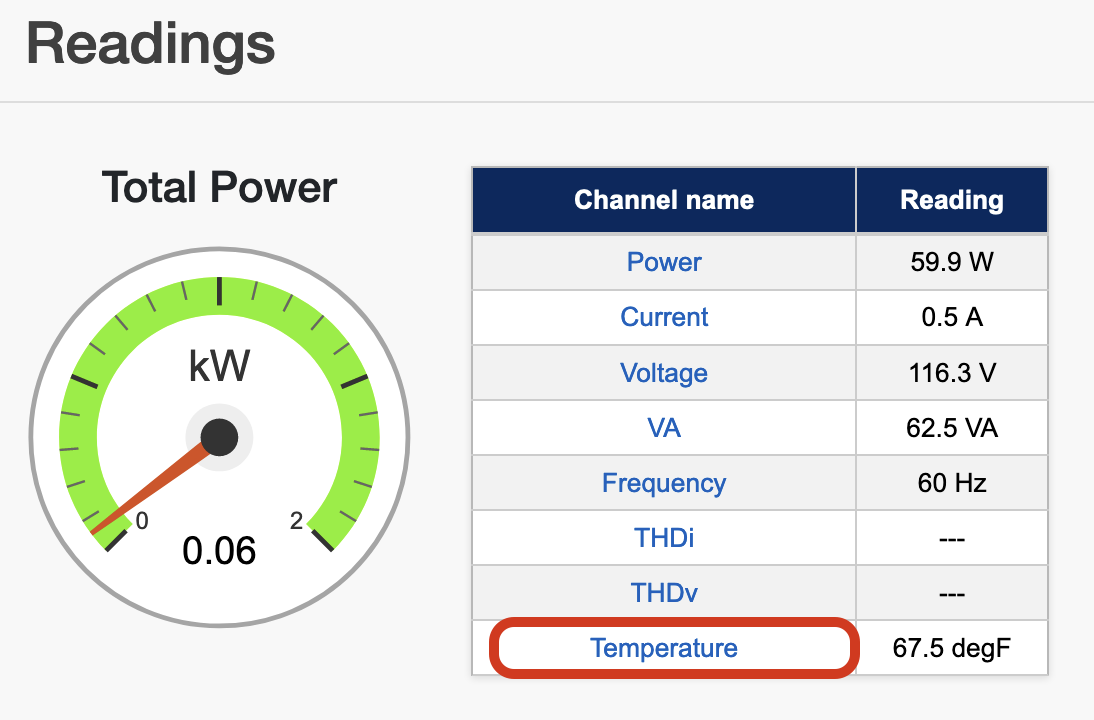
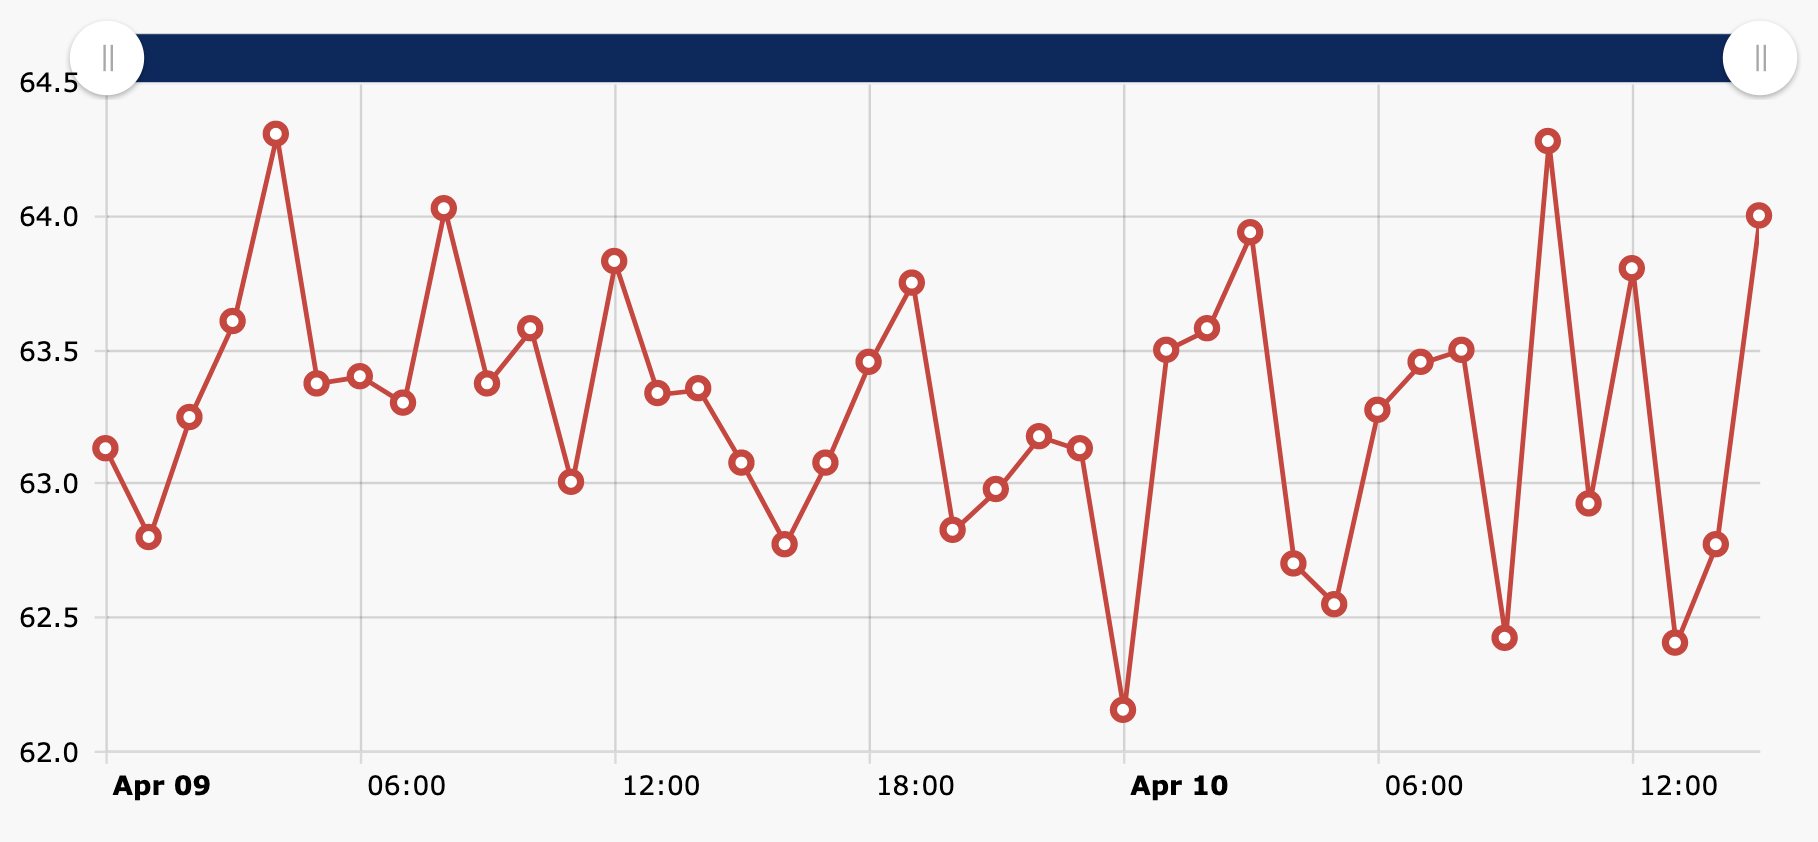
Follow the same steps as outlined in Viewing Node Details to change the timeframe, zero in on a particular data point, and click and drag a portion of the chart to zoom in on that time period.
To switch your temperature readings between Celsius and Fahrenheit, contact support@packetpower.com.