

Here are some quick tips on how to get the most from EMX.
Using Tables
You will come across numerous tables in EMX. Things to know about tables:
-
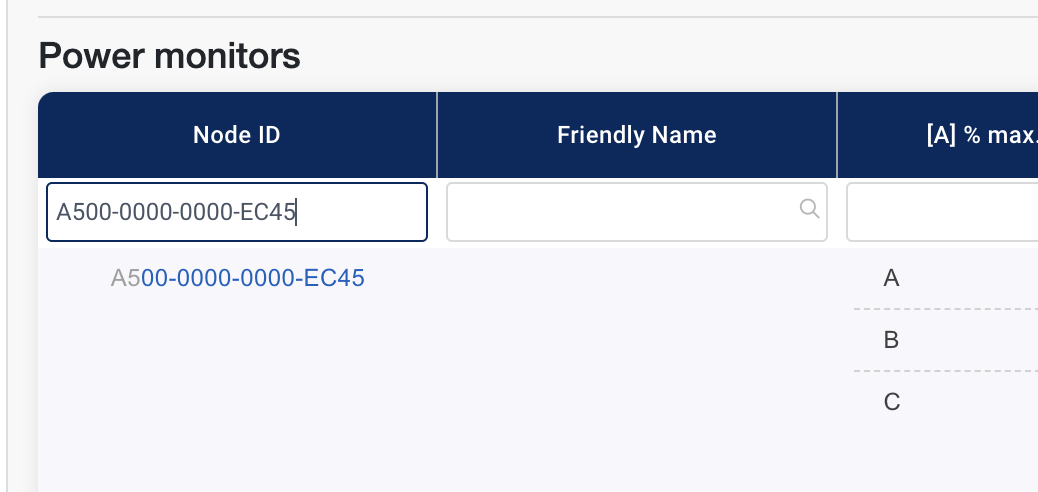
Search for an item by clicking in the empty cell below the column header and then typing the entry for which you want to search.
-
Click a 16-digit node number to view its detail page.
-
Sort a column by clicking the column header (e.g., by phase).
-
Select a row by clicking on it or select multiple rows with control + click or command + click on MacOS. This will highlight the row(s) in blue.
-
Copy selected rows content by clicking control-c or command-c on MacOS. This copies the selected rows contents into a pasteable CSV format.
-
Resize columns to prefered width by hovering on the columns right border then clicking and dragging.
-
Change the number of records per page by clicking the select at the bottom of the table.
-
Move to the next or previous page by clicking the arrows at the bottom of the table or by typing the page number to which you want to go.
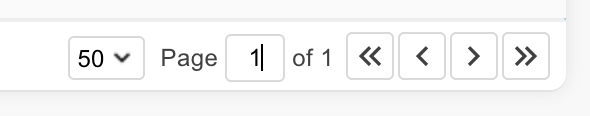
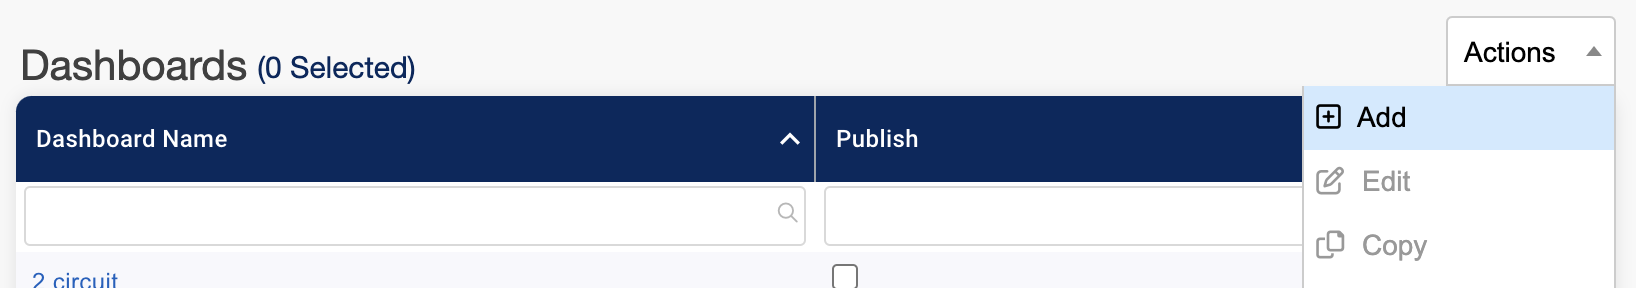
Table Actions
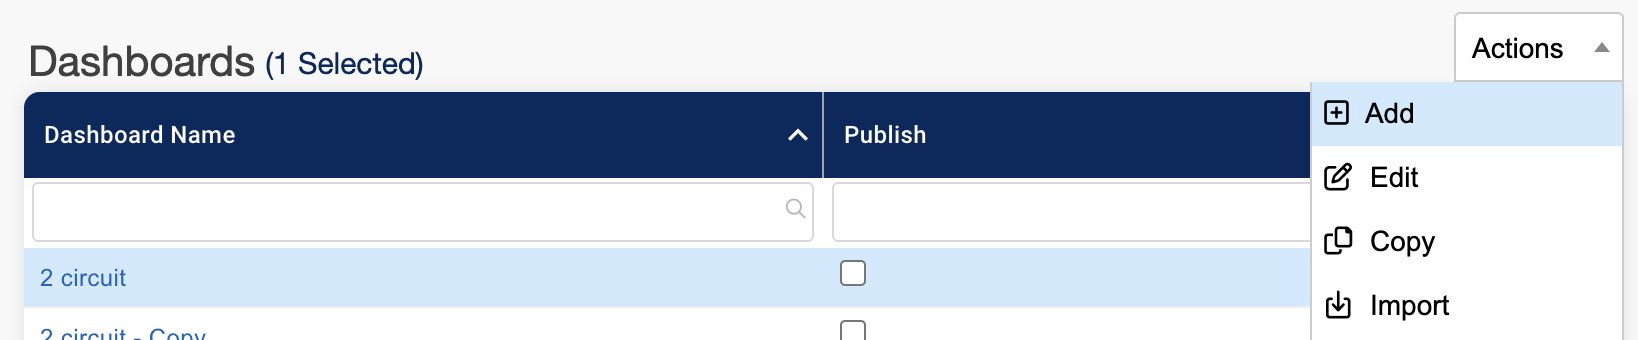
Some tables allow actions like Add, Edit, Delete, etc. When these actions are available an “Actions” drop down will appear above the table.
-
Select the row(s) you want to perform the action on (if necessary) then open the drop down and select the action you want to perform.
-
Certain actions will be disabled if the number of selected rows is too many or too little to perform the action.
To read more about tables see: Custom Tables
Viewing Monitor Readings
EMX offers a variety of ways to access information from the power monitoring units.
-
Readings and historical data for power monitors
-
Readings and historical data for environmental monitors
-
Readings and historical data for panels
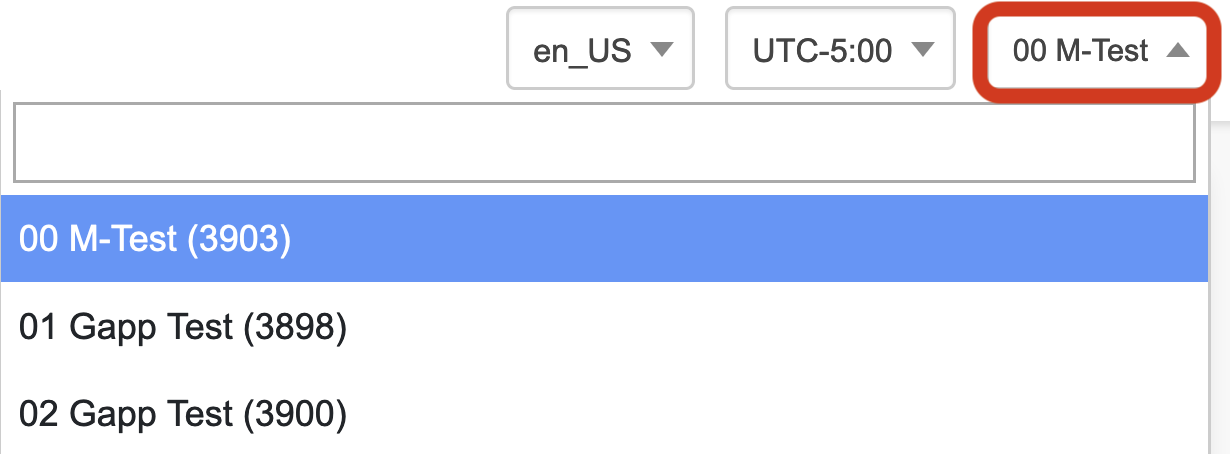
Changing Your Account
Use the top right Account selector to choose an Account.
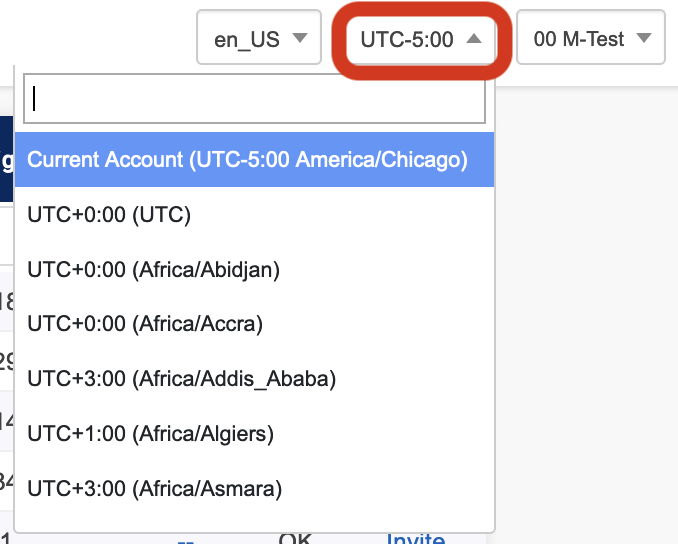
Changing Timezone
Use the drop down in the top right to select your timezone.
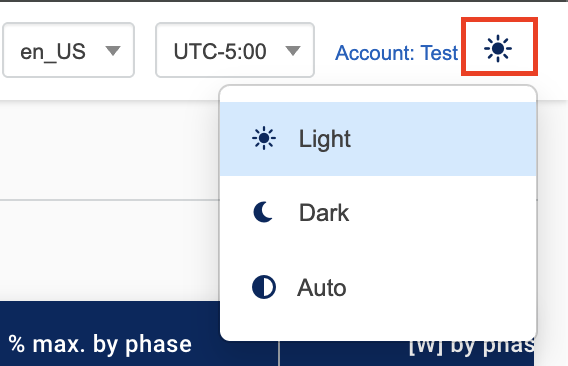
Changing Display Modes
The display mode icon in the top navigation bar shows your current theme. Click it to open a menu and choose from three options:
-
Light Mode — always displays EMX with a light background
-
Dark Mode — always displays EMX with a dark background
-
Auto — follows your device or browser's theme preference automatically
Your selection is saved and applied across all pages. For more information on display modes, see EMX Display Modes. For logo and brand color customization, see Customize Interface.
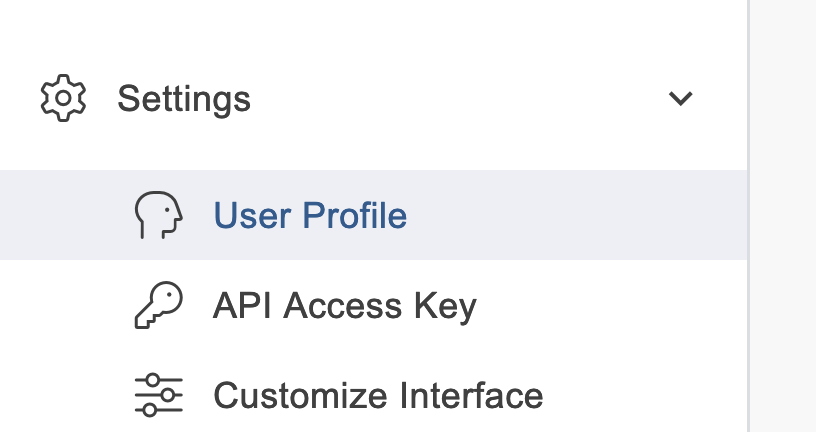
User Profile Settings
From the Nav bar under Settings, User Profile settings will allow you to change your name, email, and password.
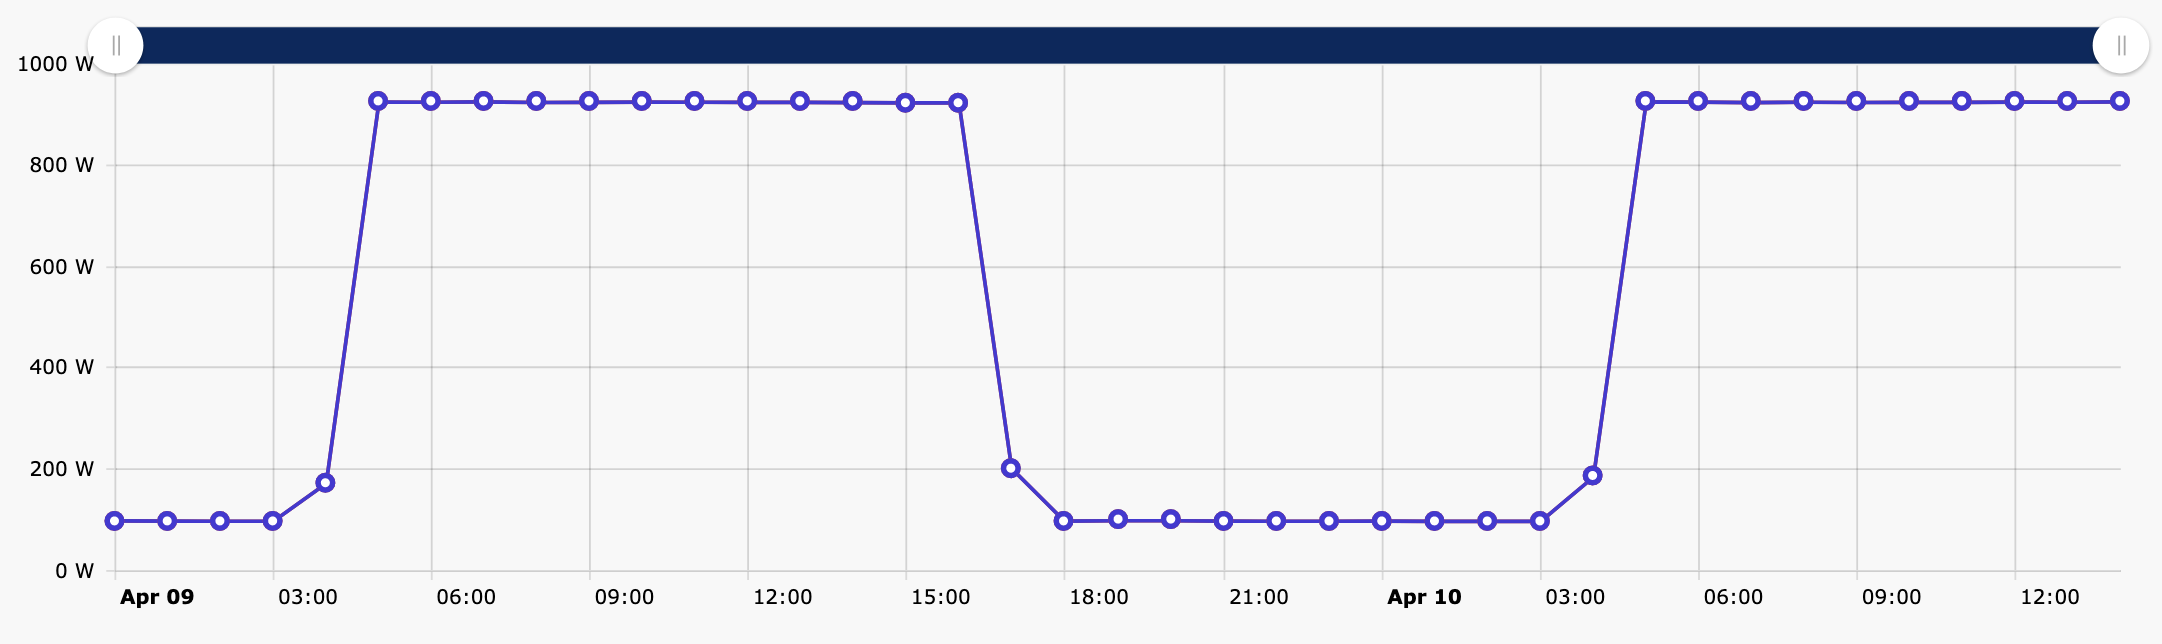
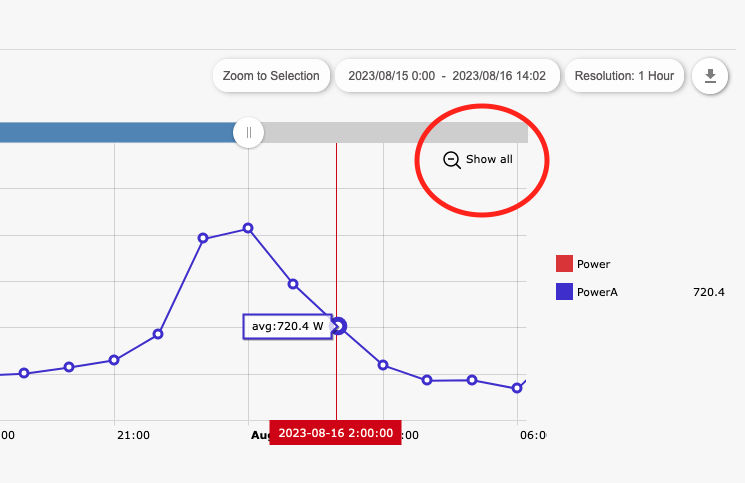
Using Dynamic Charts
There are numerous dynamic charts full of information. Some things to remember about dynamic charts:
-
Click a node ID number (or friendly name) to view detailed data for that particular node.
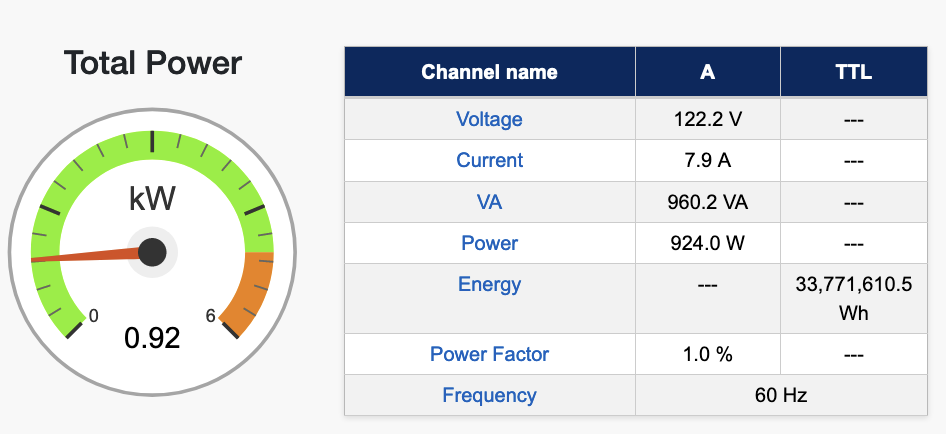
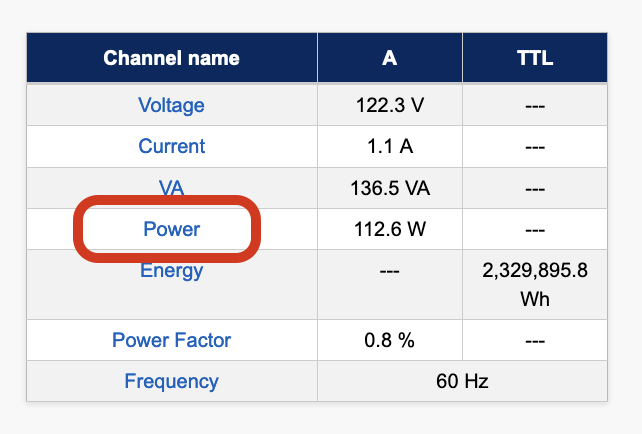
-
Click a control at the top of the page to view detailed information for that channel (e.g., Power).
-
You can view data for the last hour, 24 hours, or 30 days by clicking the corresponding button at the bottom of the table.
-
You can view lifetime data by clicking Show All in the upper-right corner of the graph.
-
Hold your cursor over a spot in the graph to view an exact measure of power for that particular date and time.
-
Click and drag a portion of the chart to zoom in on that time period.
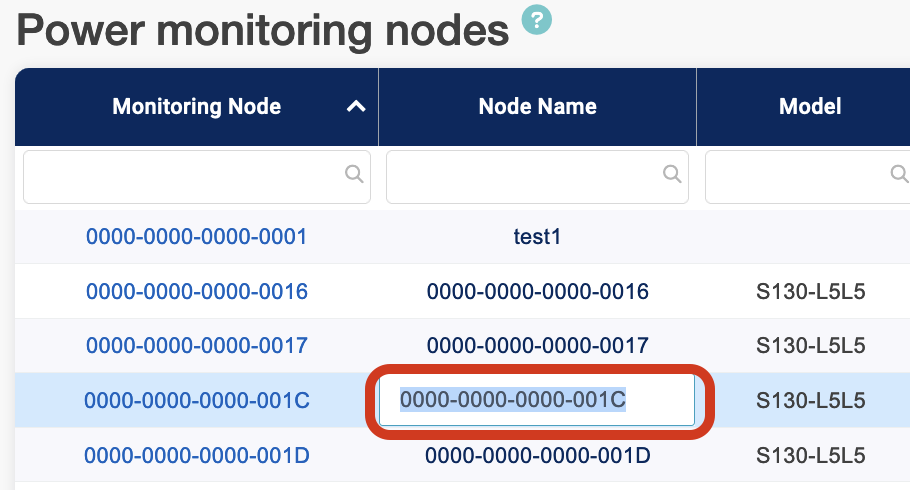
Creating Friendly Names
You can create friendly names in addition to the 16-digit ID number (e.g., A800-0000-0000-1234) for a monitoring node. Navigate to Standard Views → Node Inventory and then click the “Node Name” field to edit.
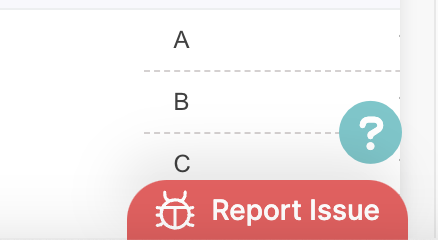
EMX Help Resources
Use the Question mark at the bottom of the screen for context sensitive documentation related to EMX.
Use the report Bug Button to report issues.
To learn more about these resources see: EMX Help Resources
or visit the Support Documentation in the nav bar under “Help”.